All plates
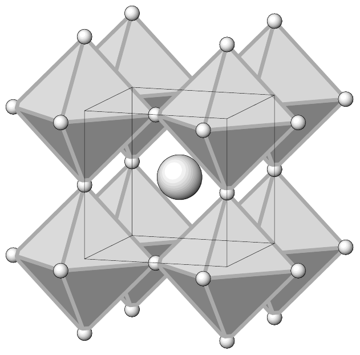 Figure 1.1 · structure-drawing · Thesis 1 · Gateshki 2003Representación esquemática de la estructura perovskita $\mathrm{ABX}_{3}$. La estructura está formada por octaedros $\mathrm{BX}_{6}$ interc…
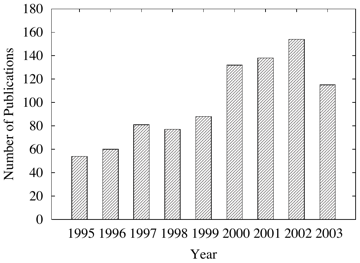 Figure 1.2 · other · Thesis 1 · Gateshki 2003Número de publicaciones relacionadas con el estudio de perovskitas dobles. El número de publicaciones para el año 2003 corresponde a los mes…
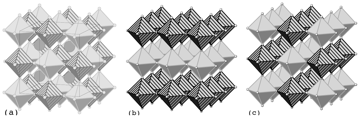 Figure 1.3 · structure-drawing · Thesis 1 · Gateshki 2003Representación esquemática de la estructura perovskita ordenada $\mathrm{A}_{2} \mathrm{BB}^{\prime} \mathrm{X}_{6}$ (a). Teóricamente se ha…
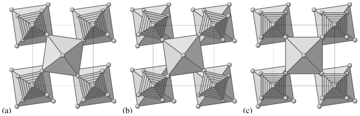 Figure 2.1 · other · Thesis 1 · Gateshki 2003Inclinaciones de octaderos en perovskitas dobles ordenadas del tipo + (a); del tipo - (b); y del tipo ± (c).
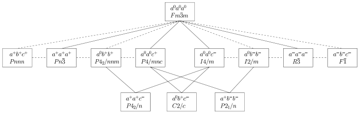 Figure 2.2 · structure-drawing · Thesis 1 · Gateshki 2003Posibles modificaciones de las estructuras de las perovskitas dobles, debidas a inclinaciones de los octaedros. Para cada modificación se mu…
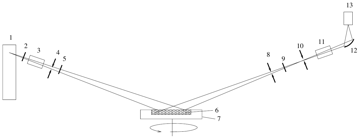 Figure 3.1 · other · Thesis 1 · Gateshki 2003Representación esquemática de la geometría focalizadora de BraggBrentano con los elementos ópticos utilizados. Los números corresponden a: 1…
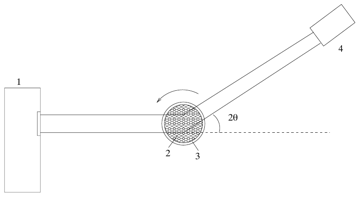 Figure 3.2 · other · Thesis 1 · Gateshki 2003Representación esquemática de la geometría Debye-Scherrer. Los números corresponden a: 1.Tubo de rayos X; 2.Muestra estudiada; 3.Capilar; 4.…
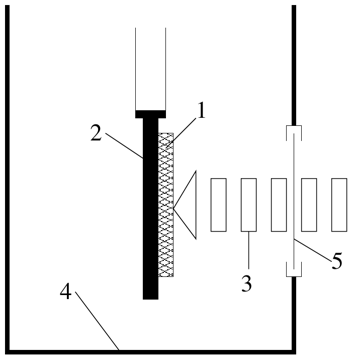 Figure 3.3 · other · Thesis 1 · Gateshki 2003Esquema simplificado del equipo fotopiroeléctrico. Los números corresponden a: 1.Muestra; 2.Detector piroeléctrico; 3.Haz de luz incidente;…
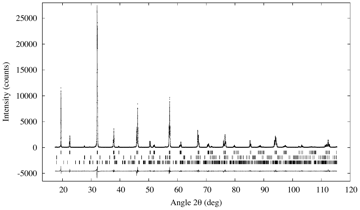 Figure 3.4 · rietveld-plot · Thesis 1 · Gateshki 2003Perfiles de difracción observado ( ⋅), calculado (一) y de la diferencia para el refinamiento Rietveld de $\mathrm{Sr}_{2} \mathrm{NiWO}_{6}$…
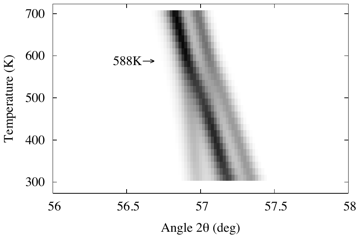 Figure 3.5 · cell-vs-t · Thesis 1 · Gateshki 2003Evolución con la temperatura de la reflexión cúbica (422) de $\mathrm{Sr}_{2} \mathrm{NiWO}_{6}$. La transición de fase continua alrededor d…
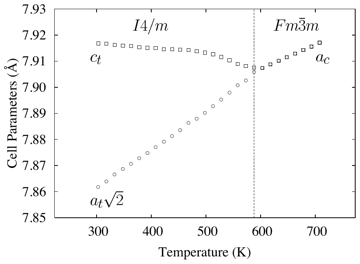 Figure 3.6 · cell-vs-t · Thesis 1 · Gateshki 2003Variación con la temperatura de los parámetros de la celda unidad de $\mathrm{Sr}_{2} \mathrm{NiWO}_{6}$. Existe una transición de fase alre…
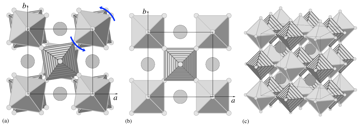 Figure 3.7 · structure-drawing · Thesis 1 · Gateshki 2003Modelos de la estructura perovskita doble con los grupos espaciales $I 4 / m$ (a) y $I 4 / m m m$ (b). En la estructura en (a), las unidades…
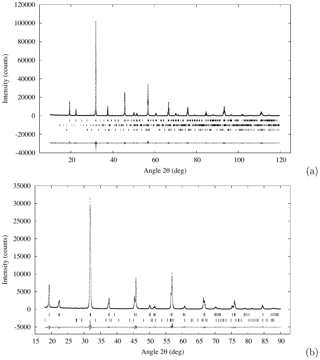 Figure 3.8 · rietveld-plot · Thesis 1 · Gateshki 2003Perfiles de difracción observados ( ⋅), calculados (—) y de la diferencia para el refinamiento Rietveld de $\mathrm{Sr}_{2} \mathrm{ZnWO}_{6}$…
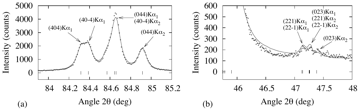 Figure 3.9 · structure-drawing · Thesis 1 · Gateshki 2003El refinamiento de la estructura de $\mathrm{Sr}_{2} \mathrm{ZnWO}_{6}$ en el grupo espacial $P 2_{1} / n$ puede explicar la forma de los pi…
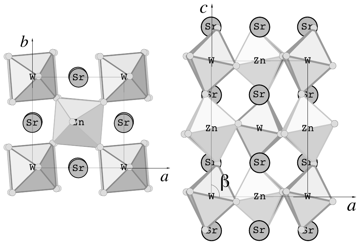 Figure 3.10 · structure-drawing · Thesis 1 · Gateshki 2003Representación esquemática de la estructura de $\mathrm{Sr}_{2} \mathrm{ZnWO}_{6}$ en la fase monoclínica. El sistema de inclinaciones que c…
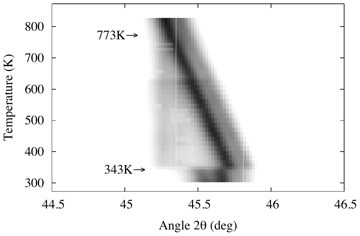 Figure 3.11 · cell-vs-t · Thesis 1 · Gateshki 2003Evolución con la temperatura de la reflexión cúbica (400) de $\mathrm{Sr}_{2} \mathrm{ZnWO}_{6}$. La transición de fase continua alrededor d…
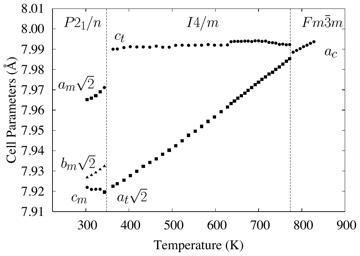 Figure 3.12 · structure-drawing · Thesis 1 · Gateshki 2003Variación con la temperatura de los parámetros de red de $\mathrm{Sr}_{2} \mathrm{ZnWO}_{6}$. La estructura de este compuesto a altas temper…
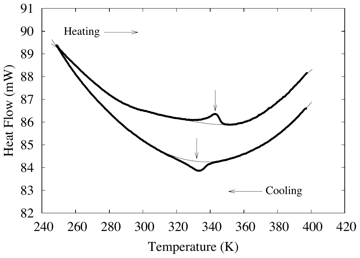 Figure 3.13 · dsc · Thesis 1 · Gateshki 2003Resultados de las medidas DSC de $\mathrm{Sr}_{2} \mathrm{ZnWO}_{6}$. La entalpía de la transición es $0.28(1) \mathrm{J} / \mathrm{g}$. Las…
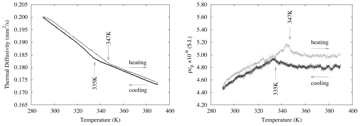 Figure 3.14 · other · Thesis 1 · Gateshki 2003Resultados de las medidas fotopiroeléctricas para la difusividad térmica (a) y $\rho c_{p}$ (b) de $\mathrm{Sr}_{2} \mathrm{ZnWO}_{6}. \rho$…
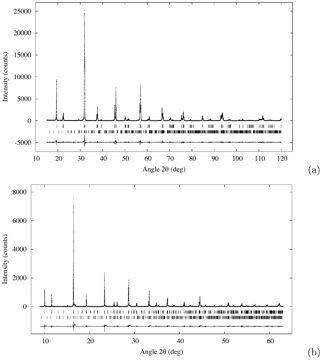 Figure 3.15 · rietveld-plot · Thesis 1 · Gateshki 2003Perfiles de difracción observados $(\cdot)$, calculados $($ — $)$ y de la diferencia para el refinamiento Rietveld de $\mathrm{Sr}_{2} \mathrm{CoWO}_{6}$…
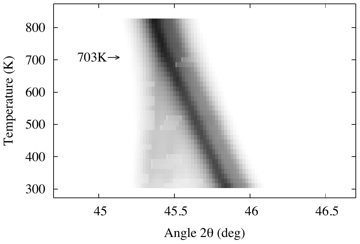 Figure 3.16 · cell-vs-t · Thesis 1 · Gateshki 2003Evolución con la temperatura de la reflexión cúbica (400) de $\mathrm{Sr}_{2} \mathrm{CoWO}_{6}$. Alrededor de 703 K aparece un desdoblamien…
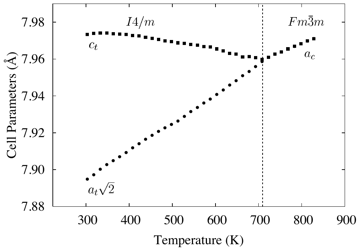 Figure 3.17 · cell-vs-t · Thesis 1 · Gateshki 2003Variación con la temperatura de los parámetros de la celda unidad de $\mathrm{Sr}_{2} \mathrm{CoWO}_{6}$. La estructura a altas temperaturas…
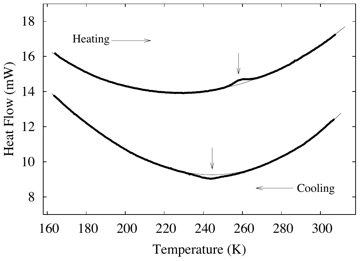 Figure 3.18 · dsc · Thesis 1 · Gateshki 2003Resultados de las medidas DSC en $\mathrm{Sr}_{2} \mathrm{CoWO}_{6}$. La entalpía de la transición de fase es $0.12(1) \mathrm{J} / \mathrm{g}$…
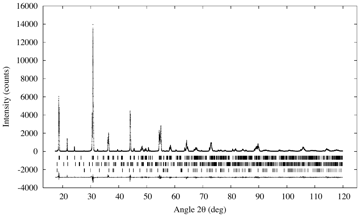 Figure 3.19 · rietveld-plot · Thesis 1 · Gateshki 2003Perfiles de difracción observado $(\cdot)$, calculado $($ — $)$ y de la diferencia para el refinamiento Rietveld de $\mathrm{Sr}_{2} \mathrm{CaWO}_{6}$…
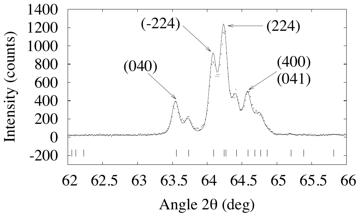 Figure 3.20 · structure-drawing · Thesis 1 · Gateshki 2003El refinamiento de la estructura de $\mathrm{Sr}_{2} \mathrm{CaWO}_{6}$ con el grupo espacial $P 2_{1} / n$ puede explicar la forma de los p…
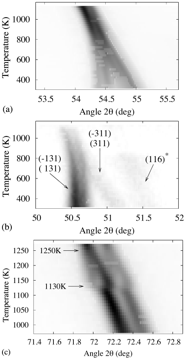 Figure 3.21 · cell-vs-t · Thesis 1 · Gateshki 2003Evolución con la temperatura de tres grupos de líneas de difracción de $\mathrm{Sr}_{2} \mathrm{CaWO}_{6}$. En (a) se puede observar un acer…
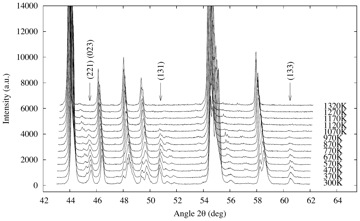 Figure 3.22 · other · Thesis 1 · Gateshki 2003Medidas de difracción de $\mathrm{Sr}_{2} \mathrm{CaWO}_{6}$ a diferentes temperaturas. Se puede observar la desaparición de los picos de di…
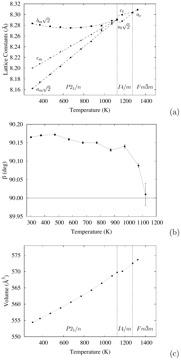 Figure 3.23 · other · Thesis 1 · Gateshki 2003Variación con la temperatura de los parámetros de red ( $\mathrm{a}, \mathrm{b}$) y el volumen de la celda unidad (c) de $\mathrm{Sr}_{2} \mathrm{CaWO}_{6}$…
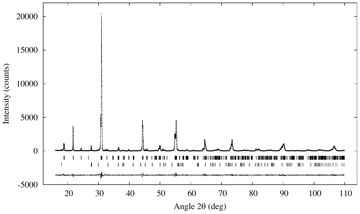 Figure 3.24 · rietveld-plot · Thesis 1 · Gateshki 2003Perfiles de difracción observado ( ⋅), calculado ( -) y de la diferencia para el refinamiento Rietveld de $\mathrm{Sr}_{2} \mathrm{CdWO}_{6}$…
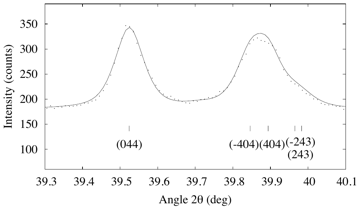 Figure 3.25 · other · Thesis 1 · Gateshki 2003Detalle del perfil de difracción de $\mathrm{Sr}_{2} \mathrm{CdWO}_{6}$ obtenido con radiación sincrotrón $(\lambda=0.8005 \AA)$. Una distor…
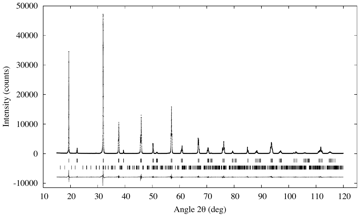 Figure 3.26 · rietveld-plot · Thesis 1 · Gateshki 2003Perfiles de difracción observado $(\cdot)$, calculado $(-)$ y de la diferencia para el refinamiento Rietveld de $\mathrm{Sr}_{2} \mathrm{MgWO}_{6}$…
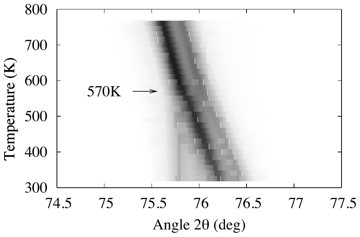 Figure 3.27 · cell-vs-t · Thesis 1 · Gateshki 2003Evolución con la temperatura de la reflexión cúbica (620) de $\mathrm{Sr}_{2} \mathrm{MgWO}_{6}$. La transición de fase continua de una fase…
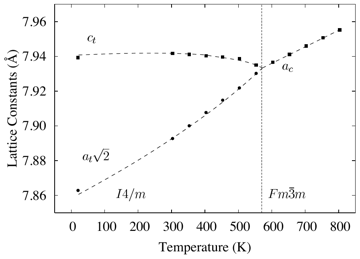 Figure 3.28 · cell-vs-t · Thesis 1 · Gateshki 2003Variación con la temperatura de los parámetros de celda de $\mathrm{Sr}_{2} \mathrm{MgWO}_{6}$.
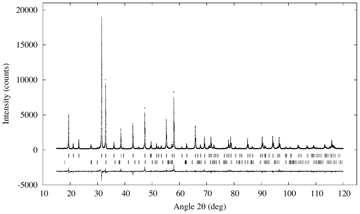 Figure 3.29 · rietveld-plot · Thesis 1 · Gateshki 2003Perfiles de difracción observado ( ⋅), calculado ( —) y de la diferencia para el refinamiento Rietveld de $\mathrm{Sr}_{2} \mathrm{CuWO}_{6}$…
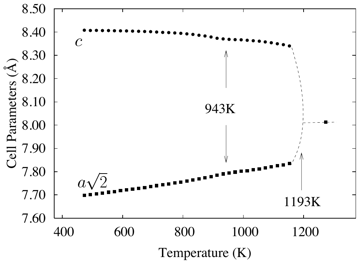 Figure 3.30 · other · Thesis 1 · Gateshki 2003Variación con la temperatura de los parámetros de red de $\mathrm{Sr}_{2} \mathrm{CuWO}_{6}$. Alrededor de 1193 K se puede observar una tran…
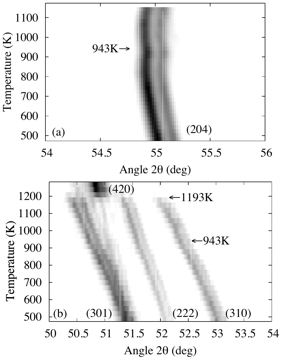 Figure 3.31 · cell-vs-t · Thesis 1 · Gateshki 2003Detalles de los perfiles de difracción de $\mathrm{Sr}_{2} \mathrm{CuWO}_{6}$, mostrando la evolución con la temperatura de algunos picos de…
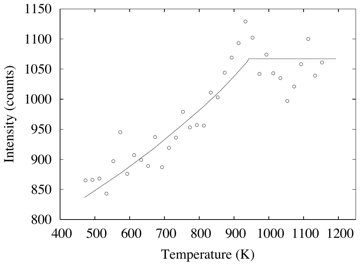 Figure 3.32 · structure-drawing · Thesis 1 · Gateshki 2003Cambio con la temperatura de la intensidad de la reflexión (222); (o) datos experimentales, (-) guía para el ojo. Esta reflexión, con intens…
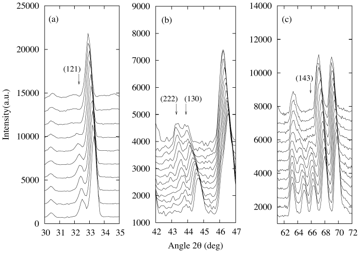 Figure 3.33 · other · Thesis 1 · Gateshki 2003Detalles de los perfiles de difracción de neutrones recogidos a diferentes temperaturas. Los datos en (a) son de la medida con capilar de V.…
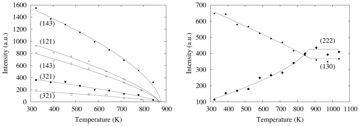 Figure 3.34 · structure-drawing · Thesis 1 · Gateshki 2003Cambios con la temperatura de las intensidades de varias líneas de difracción en las medidas de difracción de neutrones. Los puntos sólidos…
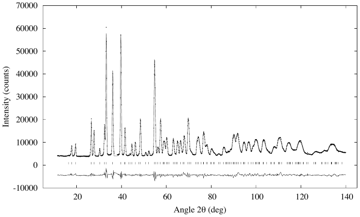 Figure 3.35 · rietveld-plot · Thesis 1 · Gateshki 2003Perfiles observado $(\cdot)$, calculado $(-)$ y de diferencia para el refinamiento de Rietveld de $\mathrm{Sr}_{2} \mathrm{CuWO}_{6}$ a temp…
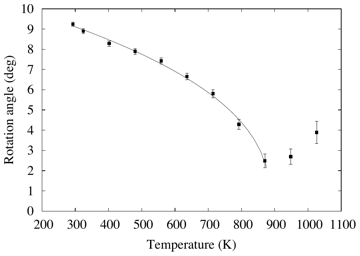 Figure 3.36 · structure-drawing · Thesis 1 · Gateshki 2003Ángulo de rotación de los octaedros $\mathrm{WO}_{6}$ refinado de los datos de difracción de neutrones a diferentes temperaturas. Las barras…
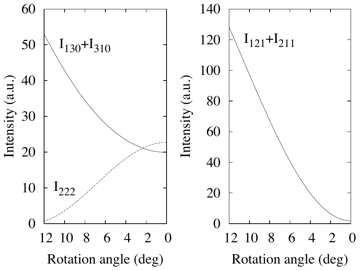 Figure 3.37 · structure-drawing · Thesis 1 · Gateshki 2003Intensidades calculadas de varias líneas de difracción de neutrones como función del ángulo de rotación de los octaedros $\mathrm{WO}_{6}$.…
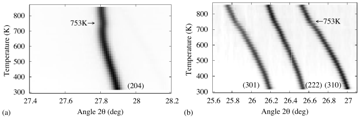 Figure 3.38 · cell-vs-t · Thesis 1 · Gateshki 2003Secciones de los perfiles de difracción de radiación sincrotrón de $\mathrm{Sr}_{2} \mathrm{CuWO}_{6}$: muestran la evolución con la tempera…
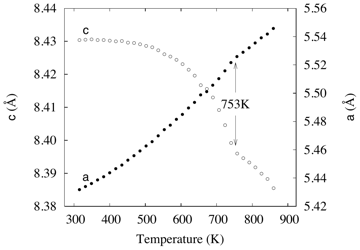 Figure 3.39 · other · Thesis 1 · Gateshki 2003Variación con la temperatura de los parámetros de red de $\mathrm{Sr}_{2} \mathrm{CuWO}_{6}$ obtenido en las medidas del sincrotrón. Alreded…
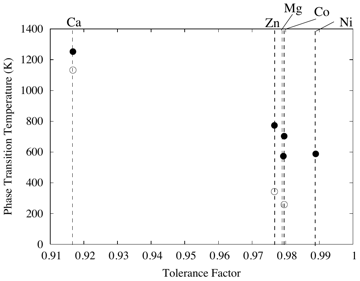 Figure 3.40 · other · Thesis 1 · Gateshki 2003Temperaturas de transición en $\mathrm{Sr}_{2} \mathrm{MWO}_{6}(\mathrm{M}=\mathrm{Ni}, \mathrm{Zn}, \mathrm{Co}, \mathrm{Ca}, \mathrm{Mg})$…
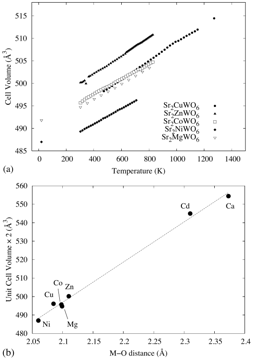 Figure 3.41 · other · Thesis 1 · Gateshki 2003(a) Variación con la temperatura de los volúmenes de celda de $\mathrm{Sr}_{2} \mathrm{MWO}_{6}(\mathrm{M}=\mathrm{Ni}, \mathrm{Zn}, \mathrm{Co}, \mathrm{Mg}, \mathrm{Cu})$…
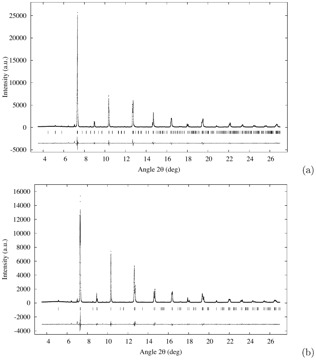 Figure 4.1 · rietveld-plot · Thesis 1 · Gateshki 2003Perfiles observados $(\cdot)$, calculados(-) y de la diferencia para el refinamiento Rietveld de $\mathrm{SrLaMnRuO}_{6}$ a temperatura ambi…
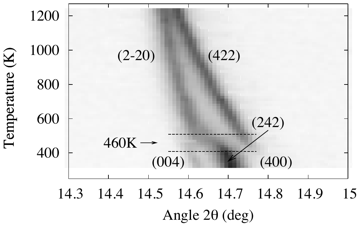 Figure 4.2 · cell-vs-t · Thesis 1 · Gateshki 2003Evolución con la temperatura del grupo de líneas de difracción con $2 \theta \approx 14.7^{\circ}$ obtenida para $\mathrm{SrLaMnRuO}_{6}$. L…
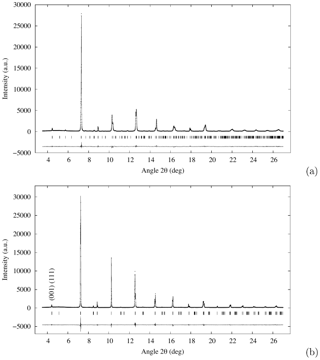 Figure 4.3 · rietveld-plot · Thesis 1 · Gateshki 2003Perfiles observados $(\cdot)$, calculados(—) y de la diferencia para los refinamientos Rietveld de $\mathrm{SrLaCuRuO}_{6}$ a temperatura am…
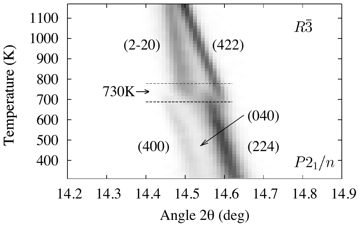 Figure 4.4 · cell-vs-t · Thesis 1 · Gateshki 2003Evolución con la temperatura del grupo de líneas de difracción en $2 \theta \approx 14.6$ obtenida para $\mathrm{SrLaCuRuO}_{6}$. La transic…
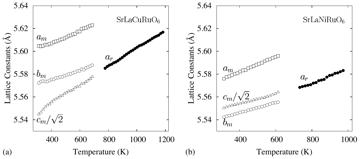 Figure 4.5 · other · Thesis 1 · Gateshki 2003Variación con la temperatura de los parámetros de red de $\mathrm{SrLaCuRuO}_{6}$ (a) y $\mathrm{SrLaNiRuO}_{6}$ (b). Los símbolos abiertos…
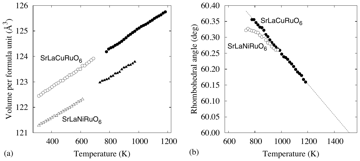 Figure 4.6 · other · Thesis 1 · Gateshki 2003Variación con la temperatura del volumen de la celda unidad (a) y el ángulo romboédrico (b) de $\mathrm{SrLaCuRuO}_{6}$ y $\mathrm{SrLaNiRuO}_{6}$…
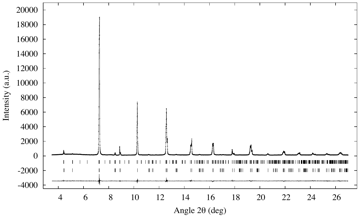 Figure 4.7 · rietveld-plot · Thesis 1 · Gateshki 2003Perfiles observado $(\cdot)$, calculado(—) y de diferencia para el refinamiento Rietveld de $\mathrm{SrLaCuRuO}_{6}$ a 730 K. Se ha realizad…
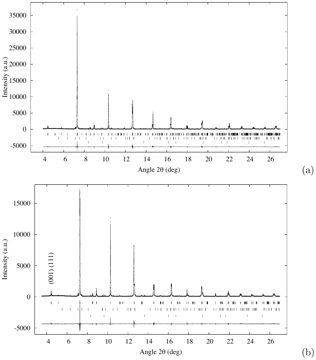 Figure 4.8 · rietveld-plot · Thesis 1 · Gateshki 2003Perfiles observados( ⋅), calculados(—) y de la diferencia para los refinamientos Rietveld de $\mathrm{SrLaNiRuO}_{6}$ a temperatura ambiente…
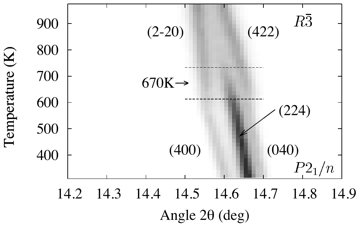 Figure 4.9 · cell-vs-t · Thesis 1 · Gateshki 2003Evolución con la temperatura del grupo de líneas de difracción con $2 \theta \approx 14.6^{\circ}$ de $\mathrm{SrLaNiRuO}_{6}$. La transició…
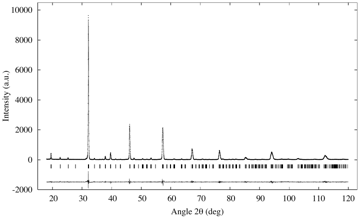 Figure 4.10 · rietveld-plot · Thesis 1 · Gateshki 2003Perfiles observado ( ⋅), calculado(—) y de la diferencia para el refinamiento Rietveld de $\mathrm{SrLaCoRuO}_{6}$ a temperatura ambiente, u…
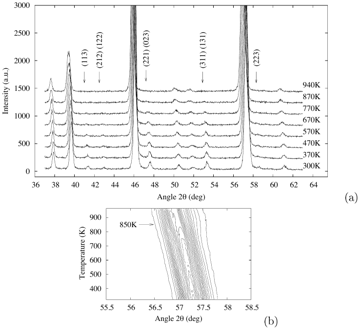 Figure 4.11 · other · Thesis 1 · Gateshki 2003Medidas de difracción a diferentes temperaturas de la muestra de SrLaCoRuO 6. La desaparición de los picos de difracción ( $h k l$) con índi…
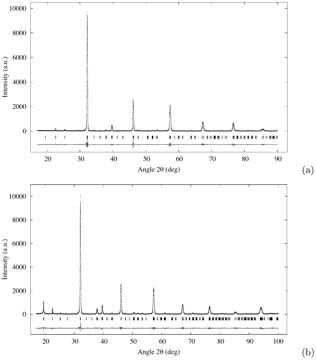 Figure 4.12 · rietveld-plot · Thesis 1 · Gateshki 2003Perfiles observados $(\cdot)$, calculados $(-)$ y de la diferencia para los refinamientos Rietveld de $\mathrm{SrLaFeRuO}_{6}$ (a) y $\mathrm{SrLaMgRuO}_{6}$…
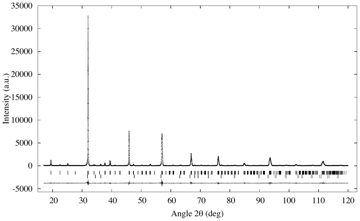 Figure 4.13 · rietveld-plot · Thesis 1 · Gateshki 2003Perfiles observado ( ⋅), calculado(—) y de la diferencia para el refinamiento Rietveld de $\mathrm{SrLaZnRuO}_{6}$ a temperatura ambiente, u…
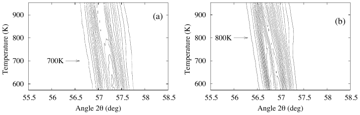 Figure 4.14 · cell-vs-t · Thesis 1 · Gateshki 2003Evolución con la temperatura de los grupos de picos de difracción de $\mathrm{SrLaFeRuO}_{6}$ (a) y $\mathrm{SrLaZnRuO}_{6}$ (b), que se enc…
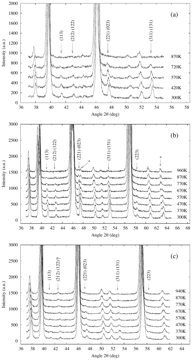 Figure 4.15 · other · Thesis 1 · Gateshki 2003Datos de difracción de $\mathrm{SrLaFeRuO}_{6}$ (a), $\mathrm{SrLaZnRuO}_{6}$ (b) y $\mathrm{SrLaMgRuO}_{6}$ (c) obtenidos a diferentes temp…
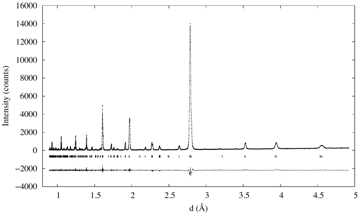 Figure 5.1 · rietveld-plot · Thesis 1 · Gateshki 2003Perfiles observado ( ⋅), calculado(-) y de la diferencia para el refinamiento Rietveld de $\mathrm{La}_{2} \mathrm{NiRuO}_{6}$ a temperatura…
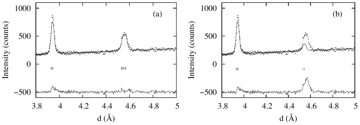 Figure 5.2 · structure-drawing · Thesis 1 · Gateshki 2003Detalle del perfil de difracción de rayos X de laboratorio refinado con los grupos espaciales $P 2_{1} / n$ (a) y $P b n m$ (b). El modelo e…
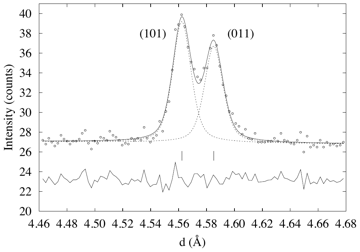 Figure 5.3 · pattern · Thesis 1 · Gateshki 2003Datos de difracción de radiación sincrotrón $(\lambda=0.8005 \AA)$ recogidos en un rango corto de $2 \theta$ alrededor de $d=4.56 \AA$. Las…
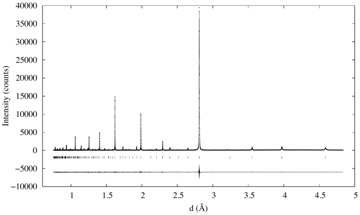 Figure 5.4 · rietveld-plot · Thesis 1 · Gateshki 2003Perfiles observado $(\cdot)$, calculado(—) y de la diferencia para el refinamiento Rietveld de $\mathrm{La}_{2} \mathrm{NiRuO}_{6}$ a 1170 K…
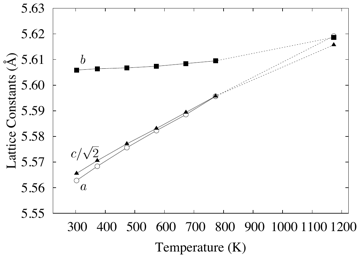 Figure 5.5 · other · Thesis 1 · Gateshki 2003Variación con la temperatura de los parámetros de red de $\mathrm{La}_{2} \mathrm{NiRuO}_{6}$. Los datos desde temperatura ambiente hasta 77…
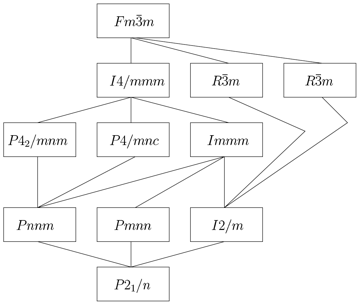 Figure 6.1 · other · Thesis 1 · Gateshki 2003Cadena de supergrupos minimales que conecta $P 2_{1} / n$ con $F m \overline{3} m$.
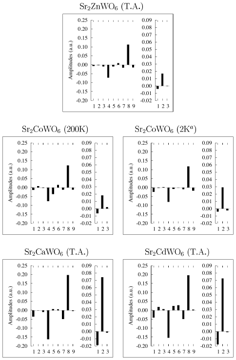 Figure 6.2 · amplitude-vs-t · Thesis 1 · Gateshki 2003Amplitudes de los modos CAM en $\mathrm{Sr}_{2} \mathrm{MWO}_{6}(\mathrm{M}=\mathrm{Zn}, \mathrm{Co}, \mathrm{Ca}, \mathrm{Cd})$. ${ }^{a}$…
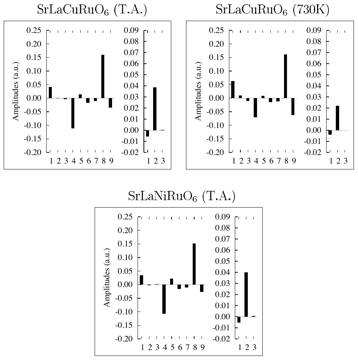 Figure 6.3 · amplitude-vs-t · Thesis 1 · Gateshki 2003Amplitudes de los modos CAM en $\mathrm{SrLaCuRuO}_{6}$ y $\mathrm{SrLaNiRuO}_{6}$.
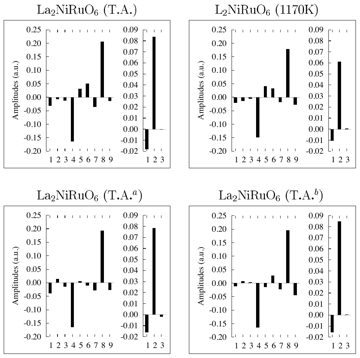 Figure 6.4 · amplitude-vs-t · Thesis 1 · Gateshki 2003Amplitudes de los modos CAM en $\mathrm{La}_{2} \mathrm{NiRuO}_{6}$. ${ }^{a}$ Estructura obtenida por P.A. Seinen et al. [99] mediante difr…
 Figure p132-1732 · other · Thesis 1 · Gateshki 2003(no caption found; uncaptioned image)
 Figure p133-1754 · other · Thesis 1 · Gateshki 2003(no caption found; uncaptioned image)
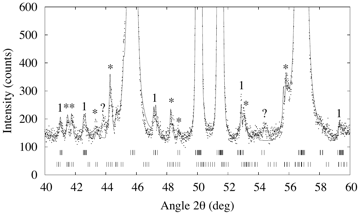 Figure p134-1761 · other · Thesis 1 · Gateshki 2003(no caption found; uncaptioned image)
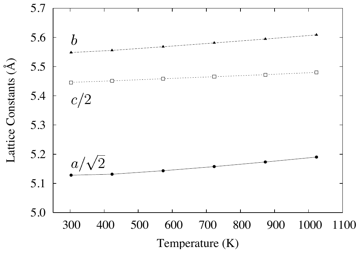 Figure p134-1764 · other · Thesis 1 · Gateshki 2003(no caption found; uncaptioned image)
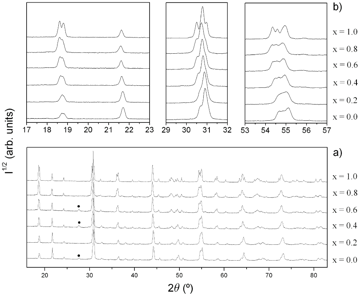 Figure 1 · pattern · Thesis 2 · Faik 2009a shows the room-temperature x-ray powder diffraction patterns for the various compositions of $\mathrm{Sr}_{2} \mathrm{Cd}_{1-x} \mathrm{Ca}_{x} \mathrm{WO}_{6}$…
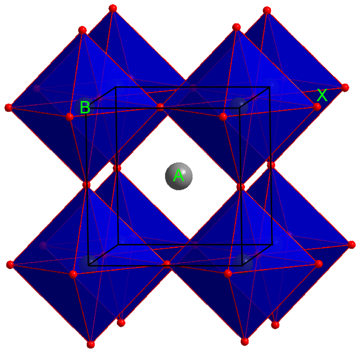 Figure 1.2 · structure-drawing · Thesis 2 · Faik 2009Representación esquemática de la estructura de la perovskita doble $\mathrm{A}_{2} \mathrm{BB}^{\prime} \mathrm{X}_{6}$: (a) completamente o…
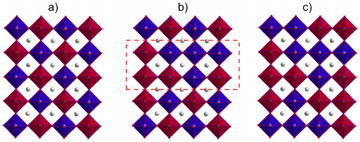 Figure 1.2-2 · structure-drawing · Thesis 2 · Faik 2009Representación esquemática de la estructura de la perovskita doble $\mathrm{A}_{2} \mathrm{BB}^{\prime} \mathrm{X}_{6}$: (a) completamente o…
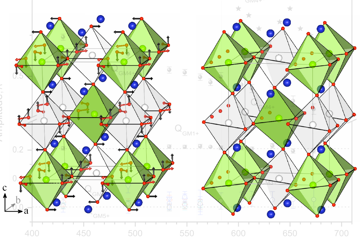 Figure p1-3 · other · Thesis 2 · Faik 2009(no caption found; uncaptioned image)
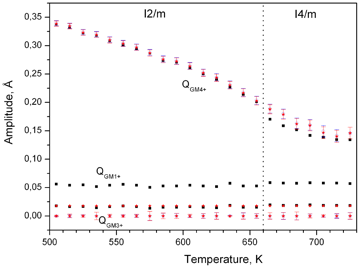 Figure 1.13 · amplitude-vs-t · Thesis 2 · Faik 2009Evolución de las amplitudes de los modos cuyas irrpes son $\Gamma_{1}^{+}$, $\Gamma_{3}^{+}$y $\Gamma_{4}^{+}$(modo primario) en la transici…
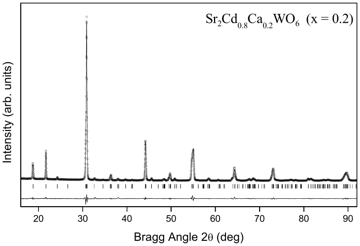 Figure 3 · cell-vs-t · Thesis 2 · Faik 2009shows the (a) $a, b$ and $c$ lattice parameters, (b) monoclinic angle ( $\beta$) and the (c) unit-cell volume of the synthesized materials.…
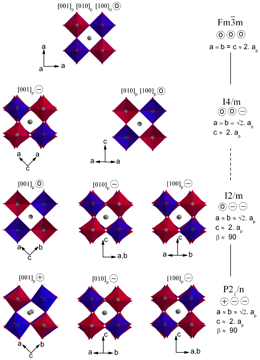 Figure 5 · structure-drawing · Thesis 2 · Faik 2009presents the projection of the room-temperature crystal structures of $\mathrm{Sr}_{2} \mathrm{ScSbO}_{6}$ and $\mathrm{Ca}_{2} \mathrm{ScSbO}_{6}$…
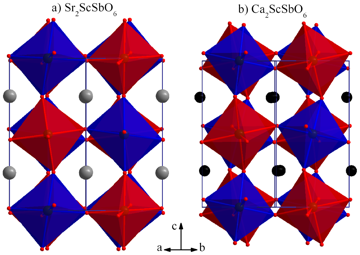 Figure 5-2 · structure-drawing · Thesis 2 · Faik 2009presents the projection of the room-temperature crystal structures of $\mathrm{Sr}_{2} \mathrm{ScSbO}_{6}$ and $\mathrm{Ca}_{2} \mathrm{ScSbO}_{6}$…
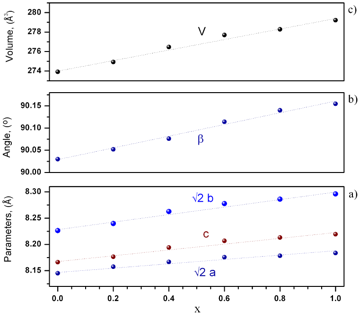 Figure 6.3 · cell-vs-t · Thesis 2 · Faik 2009Evolution, as a function of increasing calcium content, ( $x=0,0.2,0.4,0.6,0.8,1.0$), at room temperature, of the (a) unit-cell volume, (b)…
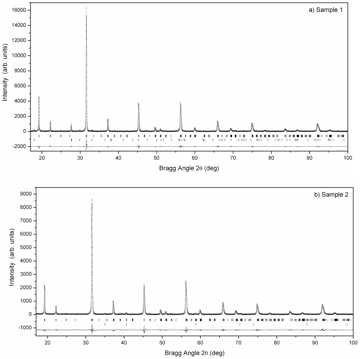 Figure 7.1 · rietveld-plot · Thesis 2 · Faik 2009Observed ( $\cdot$), calculated ( -) and difference profiles for the Rietveld refinement of $\mathrm{Sr}_{2} \mathrm{Mn}^{2+} \mathrm{WO}_{6}$…
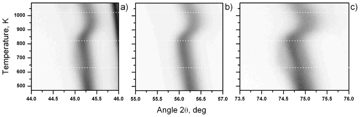 Figure 7.1-2 · rietveld-plot · Thesis 2 · Faik 2009Observed ( $\cdot$), calculated ( -) and difference profiles for the Rietveld refinement of $\mathrm{Sr}_{2} \mathrm{Mn}^{2+} \mathrm{WO}_{6}$…
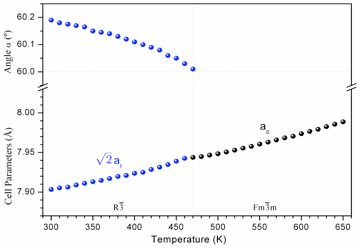 Figure 8 · cell-vs-t · Thesis 2 · Faik 2009shows the evolution with temperature of the lattice parameters of $\mathrm{Sr}_{2} \mathrm{CoSbO}_{6}$. In this figure we have represented t…
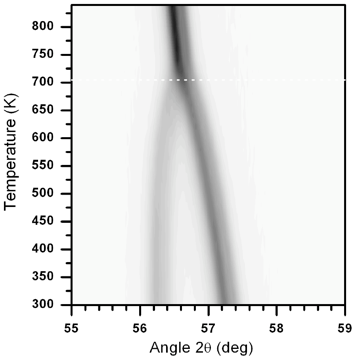 Figure 9 · other · Thesis 2 · Faik 2009shows the phase transition temperatures as a function of the tolerance factor $t$. From this figure, we conclude that the phase transition t…
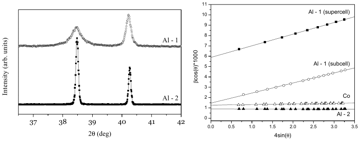 Figure 9.3 · structure-drawing · Thesis 2 · Faik 2009Raman spectra of $\mathrm{Sr}_{2} \mathrm{AlSbO}_{6}$ (sample 1) at different temperatures (excitation 514.5 nm). No significant changes are…
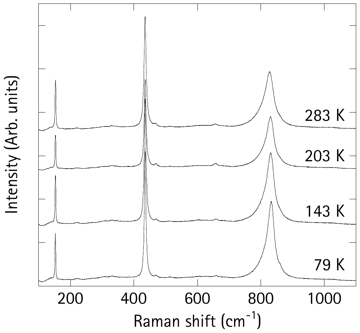 Figure 9.3-2 · structure-drawing · Thesis 2 · Faik 2009Raman spectra of $\mathrm{Sr}_{2} \mathrm{AlSbO}_{6}$ (sample 1) at different temperatures (excitation 514.5 nm). No significant changes are…
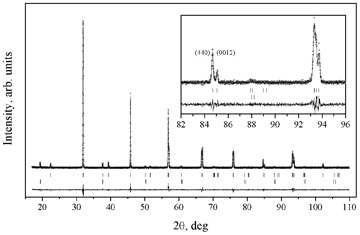 Figure 9.3-3 · structure-drawing · Thesis 2 · Faik 2009Raman spectra of $\mathrm{Sr}_{2} \mathrm{AlSbO}_{6}$ (sample 1) at different temperatures (excitation 514.5 nm). No significant changes are…
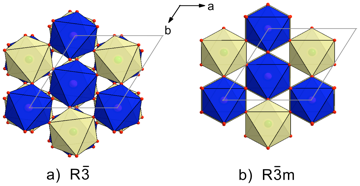 Figure 9.6 · rietveld-plot · Thesis 2 · Faik 2009Rietveld refinement of $\mathrm{Sr}_{2} \mathrm{CoSbO}_{6}$, at room temperature, using the $R \overline{3}$ and $R \overline{3} m$ space gr…
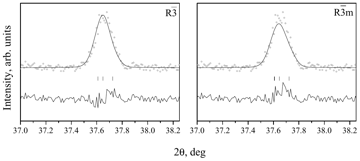 Figure 9.6-2 · rietveld-plot · Thesis 2 · Faik 2009Rietveld refinement of $\mathrm{Sr}_{2} \mathrm{CoSbO}_{6}$, at room temperature, using the $R \overline{3}$ and $R \overline{3} m$ space gr…
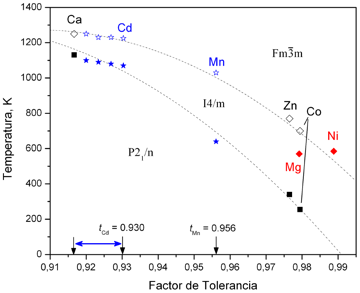 Figure 10 · other · Thesis 2 · Faik 2009
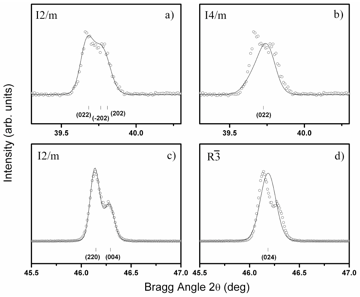 Figure 10.1 · pattern · Thesis 2 · Faik 2009(a) and (b) Section of the diffractogram of the XRPD measurements refined in the $I 2 / m$ and $I 4 / m$ space groups, respectively, to show…
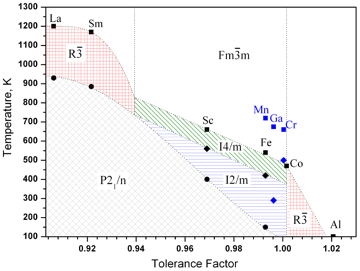 Figure 11 · other · Thesis 2 · Faik 2009
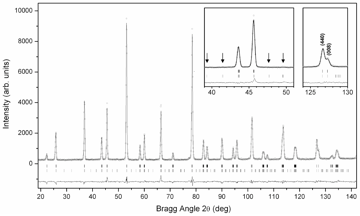 Figure 12 · rietveld-plot · Thesis 2 · Faik 2009shows the evolution of diffraction intensities of this reflection with temperature. From the profile shape characteristic reflections at $2 \theta$…
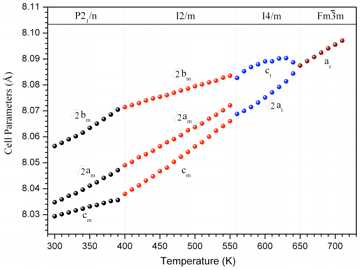 Figure 12-2 · rietveld-plot · Thesis 2 · Faik 2009shows the evolution of diffraction intensities of this reflection with temperature. From the profile shape characteristic reflections at $2 \theta$…
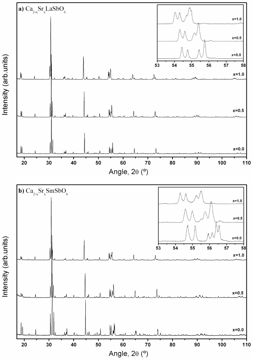 Figure 12.3 · pattern · Thesis 2 · Faik 2009Evolution of the laboratory X-ray diffraction pattern at room temperature of $\mathrm{Ca}_{2-x} \mathrm{Sr}_{x} \mathrm{LaSbO}_{6}$ (a) and…
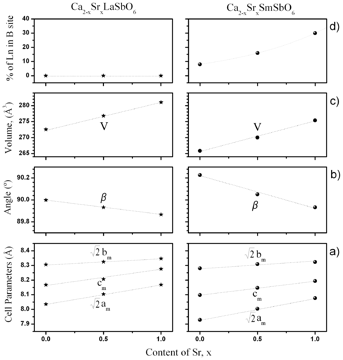 Figure 12.3-2 · pattern · Thesis 2 · Faik 2009Evolution of the laboratory X-ray diffraction pattern at room temperature of $\mathrm{Ca}_{2-x} \mathrm{Sr}_{x} \mathrm{LaSbO}_{6}$ (a) and…
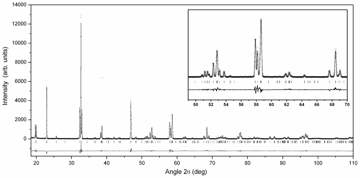 Figure 14.7 · rietveld-plot · Thesis 2 · Faik 2009Observed X-ray patterns (symbols), calculated (line) and difference profiles for the Rietveld refinement of $\mathrm{Ca}_{2} \mathrm{FeSbO}_{6}$…
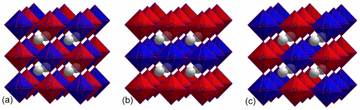 Figure p32-316 · other · Thesis 2 · Faik 2009(no caption found; uncaptioned image)
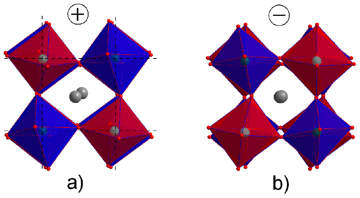 Figure p37-392 · other · Thesis 2 · Faik 2009(no caption found; uncaptioned image)
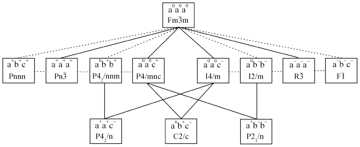 Figure p38-403 · other · Thesis 2 · Faik 2009(no caption found; uncaptioned image)
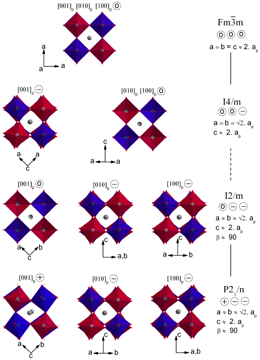 Figure p40-438 · other · Thesis 2 · Faik 2009(no caption found; uncaptioned image)
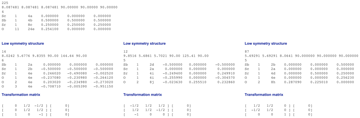 Figure p43-465 · other · Thesis 2 · Faik 2009(no caption found; uncaptioned image)
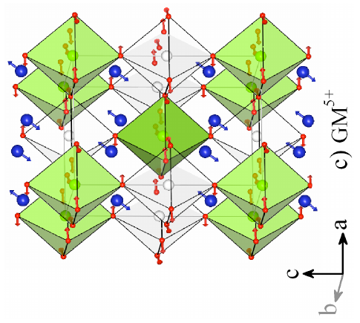 Figure p45-484 · other · Thesis 2 · Faik 2009(no caption found; uncaptioned image)
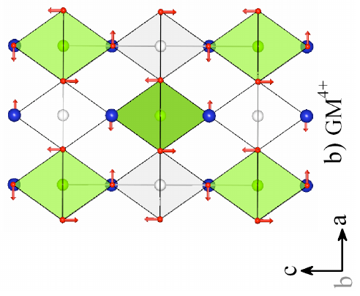 Figure p45-485 · other · Thesis 2 · Faik 2009(no caption found; uncaptioned image)
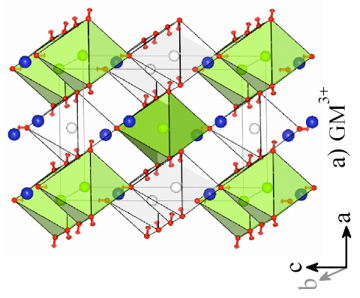 Figure p45-486 · other · Thesis 2 · Faik 2009(no caption found; uncaptioned image)
 Figure p46-490 · other · Thesis 2 · Faik 2009(no caption found; uncaptioned image)
 Figure p48-499 · other · Thesis 2 · Faik 2009(no caption found; uncaptioned image)
 Figure p49-508 · other · Thesis 2 · Faik 2009(no caption found; uncaptioned image)
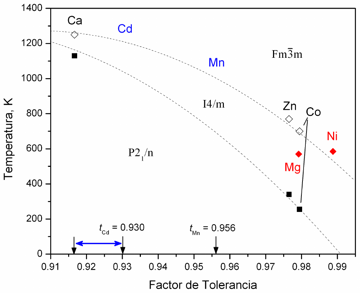 Figure p71-796 · other · Thesis 2 · Faik 2009(no caption found; uncaptioned image)
 Figure p72-819 · other · Thesis 2 · Faik 2009(no caption found; uncaptioned image)
 Figure p78-868 · other · Thesis 2 · Faik 2009(no caption found; uncaptioned image)
 Figure p79-902 · other · Thesis 2 · Faik 2009(no caption found; uncaptioned image)
 Figure p80-905 · other · Thesis 2 · Faik 2009(no caption found; uncaptioned image)
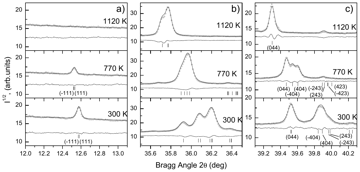 Figure p81-915 · other · Thesis 2 · Faik 2009(no caption found; uncaptioned image)
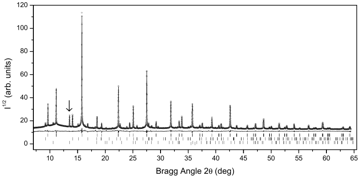 Figure p81-918 · other · Thesis 2 · Faik 2009(no caption found; uncaptioned image)
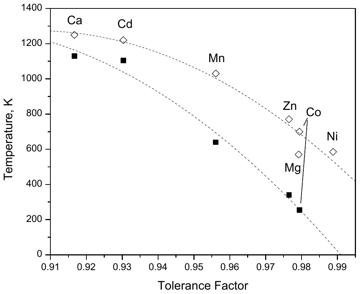 Figure p83-931 · other · Thesis 2 · Faik 2009(no caption found; uncaptioned image)
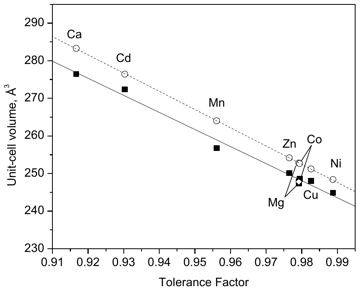 Figure p84-940 · other · Thesis 2 · Faik 2009(no caption found; uncaptioned image)
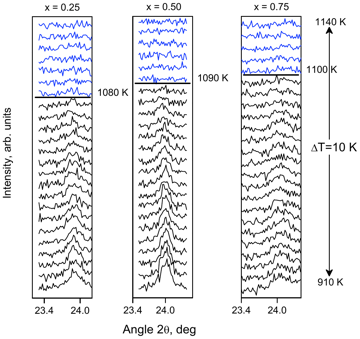 Figure p91-1018 · other · Thesis 2 · Faik 2009(no caption found; uncaptioned image)
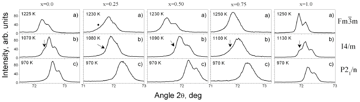 Figure p92-1029 · other · Thesis 2 · Faik 2009(no caption found; uncaptioned image)
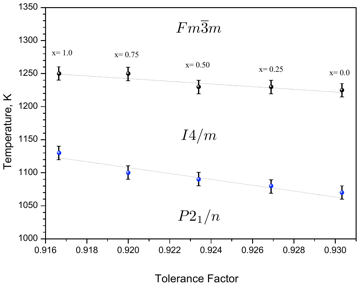 Figure p93-1032 · other · Thesis 2 · Faik 2009(no caption found; uncaptioned image)
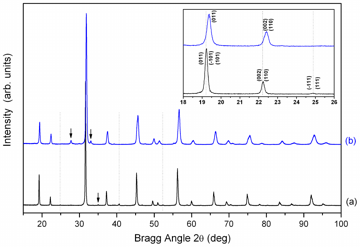 Figure p99-1078 · other · Thesis 2 · Faik 2009(no caption found; uncaptioned image)
 Figure p100-1086 · other · Thesis 2 · Faik 2009(no caption found; uncaptioned image)
 Figure p101-1092 · other · Thesis 2 · Faik 2009(no caption found; uncaptioned image)
 Figure p102-1105 · other · Thesis 2 · Faik 2009(no caption found; uncaptioned image)
 Figure p104-1141 · other · Thesis 2 · Faik 2009(no caption found; uncaptioned image)
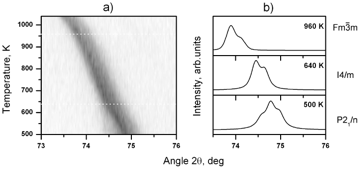 Figure p105-1146 · other · Thesis 2 · Faik 2009(no caption found; uncaptioned image)
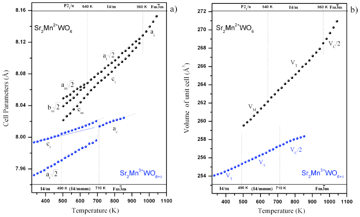 Figure p107-1164 · other · Thesis 2 · Faik 2009(no caption found; uncaptioned image)
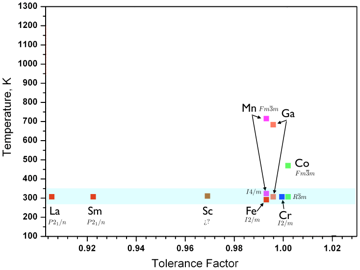 Figure p112-1187 · other · Thesis 2 · Faik 2009(no caption found; uncaptioned image)
 Figure p119-1290 · other · Thesis 2 · Faik 2009(no caption found; uncaptioned image)
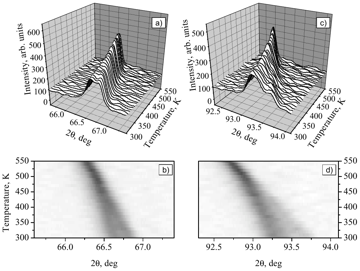 Figure p124-1337 · other · Thesis 2 · Faik 2009(no caption found; uncaptioned image)
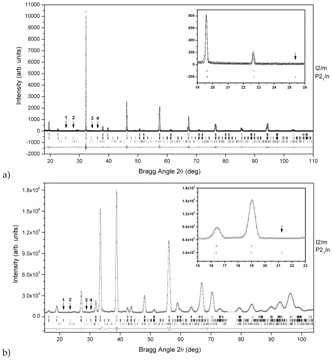 Figure p131-1415 · other · Thesis 2 · Faik 2009(no caption found; uncaptioned image)
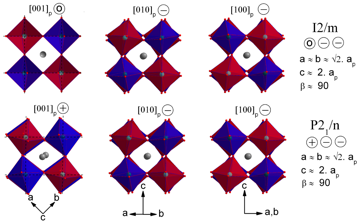 Figure p134-1470 · other · Thesis 2 · Faik 2009(no caption found; uncaptioned image)
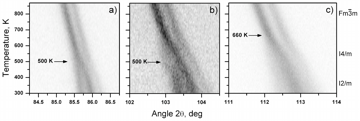 Figure p135-1479 · other · Thesis 2 · Faik 2009(no caption found; uncaptioned image)
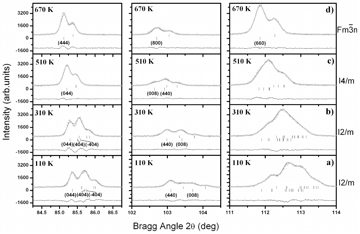 Figure p135-1482 · other · Thesis 2 · Faik 2009(no caption found; uncaptioned image)
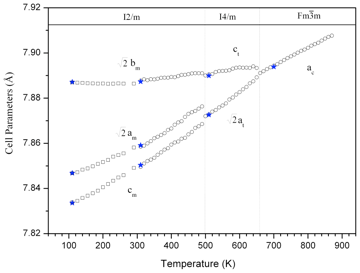 Figure p136-1485 · other · Thesis 2 · Faik 2009(no caption found; uncaptioned image)
 Figure p138-1526 · other · Thesis 2 · Faik 2009(no caption found; uncaptioned image)
 Figure p139-1533 · other · Thesis 2 · Faik 2009(no caption found; uncaptioned image)
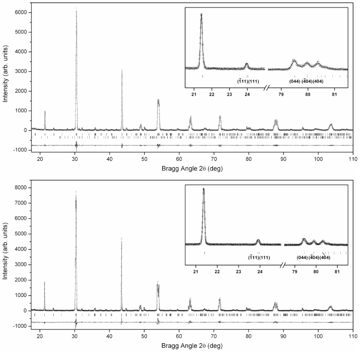 Figure p143-1562 · other · Thesis 2 · Faik 2009(no caption found; uncaptioned image)
 Figure p147-1628 · other · Thesis 2 · Faik 2009(no caption found; uncaptioned image)
 Figure p148-1639 · other · Thesis 2 · Faik 2009(no caption found; uncaptioned image)
 Figure p149-1646 · other · Thesis 2 · Faik 2009(no caption found; uncaptioned image)
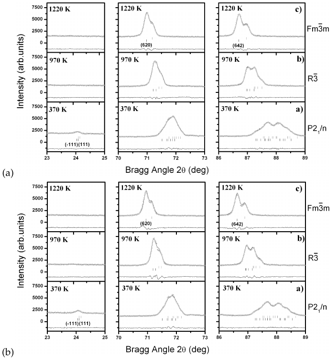 Figure p150-1653 · other · Thesis 2 · Faik 2009(no caption found; uncaptioned image)
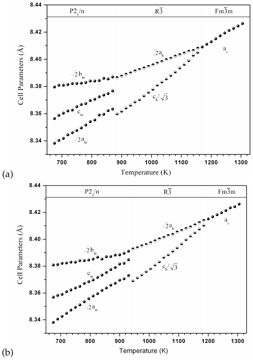 Figure p152-1662 · other · Thesis 2 · Faik 2009(no caption found; uncaptioned image)
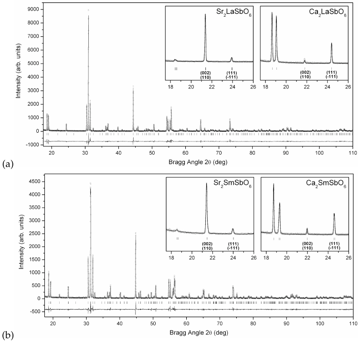 Figure p155-1685 · other · Thesis 2 · Faik 2009(no caption found; uncaptioned image)
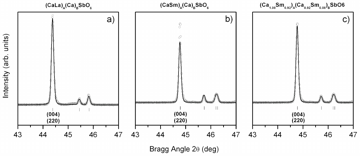 Figure p156-1688 · other · Thesis 2 · Faik 2009(no caption found; uncaptioned image)
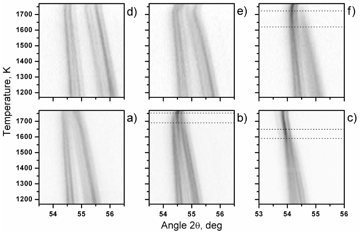 Figure p163-1784 · other · Thesis 2 · Faik 2009(no caption found; uncaptioned image)
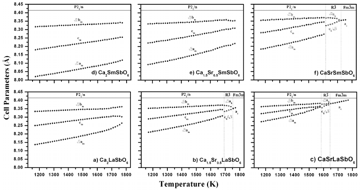 Figure p164-1791 · other · Thesis 2 · Faik 2009(no caption found; uncaptioned image)
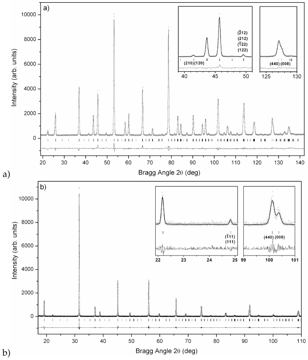 Figure p168-1847 · other · Thesis 2 · Faik 2009(no caption found; uncaptioned image)
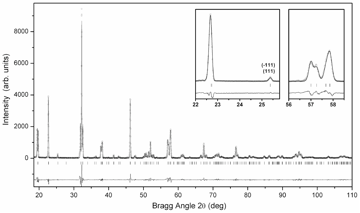 Figure p169-1850 · other · Thesis 2 · Faik 2009(no caption found; uncaptioned image)
 Figure p171-1897 · other · Thesis 2 · Faik 2009(no caption found; uncaptioned image)
 Figure p175-1923 · other · Thesis 2 · Faik 2009(no caption found; uncaptioned image)
 Figure p176-1932 · other · Thesis 2 · Faik 2009(no caption found; uncaptioned image)
 Figure p177-1939 · other · Thesis 2 · Faik 2009(no caption found; uncaptioned image)
 Figure p179-1969 · other · Thesis 2 · Faik 2009(no caption found; uncaptioned image)
 Figure p181-1984 · other · Thesis 2 · Faik 2009(no caption found; uncaptioned image)
 Figure p181-1987 · other · Thesis 2 · Faik 2009(no caption found; uncaptioned image)
 Figure p185-2010 · other · Thesis 2 · Faik 2009(no caption found; uncaptioned image)
 Figure p190-2059 · other · Thesis 2 · Faik 2009(no caption found; uncaptioned image)
 Figure p192-2104 · other · Thesis 2 · Faik 2009(no caption found; uncaptioned image)
 Figure p193-2110 · other · Thesis 2 · Faik 2009(no caption found; uncaptioned image)
 Figure p193-2113 · other · Thesis 2 · Faik 2009(no caption found; uncaptioned image)
 Figure p195-2154 · other · Thesis 2 · Faik 2009(no caption found; uncaptioned image)
 Figure p196-2161 · other · Thesis 2 · Faik 2009(no caption found; uncaptioned image)
 Figure p198-2181 · other · Thesis 2 · Faik 2009(no caption found; uncaptioned image)
 Figure p202-2239 · other · Thesis 2 · Faik 2009(no caption found; uncaptioned image)
 Figure p203-2248 · other · Thesis 2 · Faik 2009(no caption found; uncaptioned image)
 Figure p203-2251 · other · Thesis 2 · Faik 2009(no caption found; uncaptioned image)
 Figure p205-2288 · other · Thesis 2 · Faik 2009(no caption found; uncaptioned image)
 Figure p206-2301 · other · Thesis 2 · Faik 2009(no caption found; uncaptioned image)
 Figure p207-2310 · other · Thesis 2 · Faik 2009(no caption found; uncaptioned image)
 Figure p210-2359 · other · Thesis 2 · Faik 2009(no caption found; uncaptioned image)
 Figure p211-2362 · other · Thesis 2 · Faik 2009(no caption found; uncaptioned image)
 Figure p219-2462 · other · Thesis 2 · Faik 2009(no caption found; uncaptioned image)
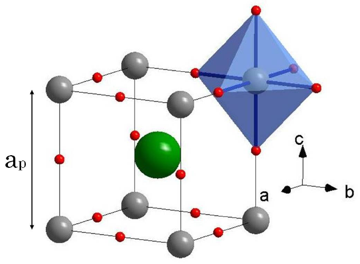 Figure 1.1 · structure-drawing · Thesis 3 · Iturbe 2012The schematic representation of the $A B O_{3}$ ideal perovskite structure, where the green, grey and red spheres represent, $A, B$ and oxyg…
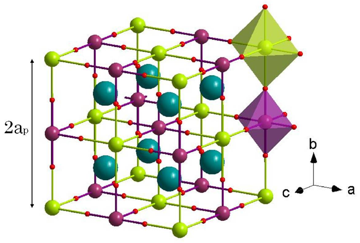 Figure 1.2 · structure-drawing · Thesis 3 · Iturbe 2012The schematic representation of the $A A^{\prime} B B^{\prime} \mathrm{O}_{6}$ ideal double perovskite structure; where $B$ cation and $B \mathrm{O}_{6}$…
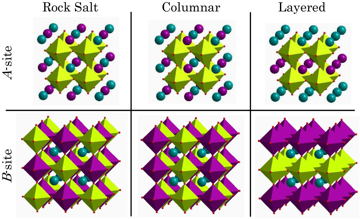 Figure 1.3 · other · Thesis 3 · Iturbe 2012Cation ordering schemes in perovskites. From left to the right: 0D (rock salt), 1D (columnar ordering), and 2D (layered ordering) are shown…
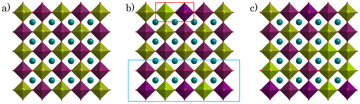 Figure 1.4 · structure-drawing · Thesis 3 · Iturbe 2012Types of ordering in perovskites with two different $B$-site cations. (a) Ideal rock-salt ordering; (b) partial rock-salt ordering with loca…
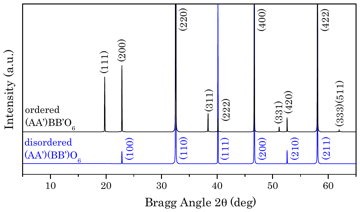 Figure 1.5 · structure-drawing · Thesis 3 · Iturbe 2012Simulated X -ray diffraction patterns for ordered $\left(A A^{\prime}\right) B B^{\prime} \mathrm{O}_{6}$ cubic structure (space group $F m \overline{3} m$…
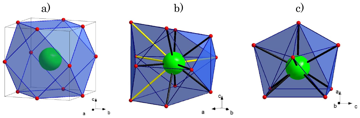 Figure 1.6 · structure-drawing · Thesis 3 · Iturbe 2012The coordination-polyhedron of $A$-site cation of the $A B \mathrm{O}_{3}$ perovskite; (a) ideal 12-fold coordination (cubo-octahedron), (b)…
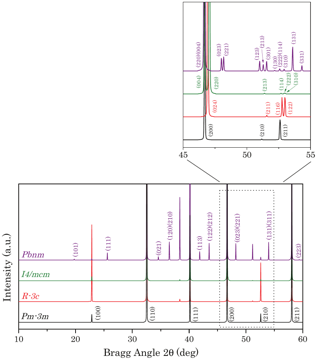 Figure 1.7 · structure-drawing · Thesis 3 · Iturbe 2012Simulated X -ray diffraction patterns for disordered $\left(A A^{\prime}\right)\left(B B^{\prime}\right) \mathrm{O}_{6}$ cubic structure (bl…
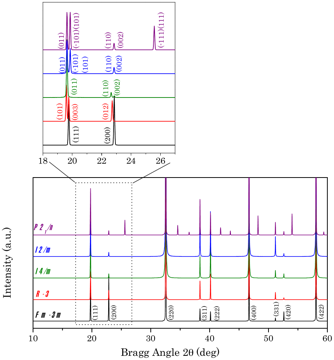 Figure 1.8 · structure-drawing · Thesis 3 · Iturbe 2012Simulated X-ray diffraction patterns for ordered $\left(A A^{\prime}\right) B B^{\prime} \mathrm{O}_{6}$ cubic structure (black) and the mos…
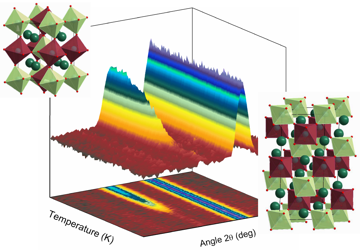 Figure p1-8 · other · Thesis 3 · Iturbe 2012(no caption found; uncaptioned image)
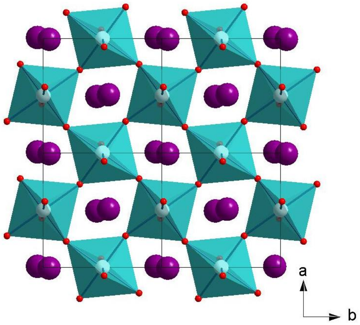 Figure 1.9 · other · Thesis 3 · Iturbe 2012Cooperative Jahn-Teller distortion of $\mathrm{LaMnO}_{3}$ [58] material.
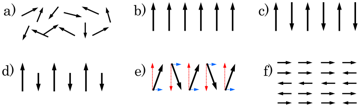 Figure 1.10 · magnetization · Thesis 3 · Iturbe 2012Schematic diagram s showing the spin arrangement of (a) paramagnet, (b) ferromagnet, (c) antiferromagnet, (d) ferrimagnet, (e) canted antife…
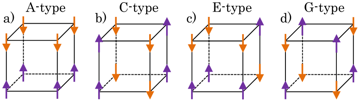 Figure 1.11 · magnetization · Thesis 3 · Iturbe 2012Schematic representation of the spin arrangements in (a) A-type, (b) C-type, (c) E-type, and (d) G-type antiferromagnetic ordering.
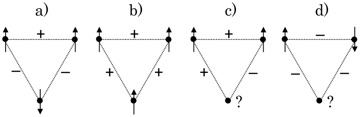 Figure 1.12 · magnetization · Thesis 3 · Iturbe 2012Examples of magnetic frustration on triangular lattice. (a) and (b) show no frustration, while, (c) and (d) show frustration associated to t…
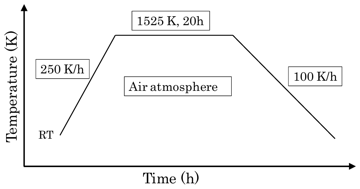 Figure 2.1 · other · Thesis 3 · Iturbe 2012Schematic representation of the synthesis treatment for double perovskite compounds.
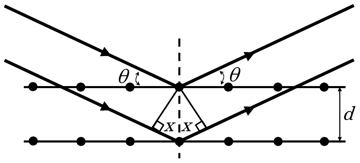 Figure 3.1 · other · Thesis 3 · Iturbe 2012Diffraction of a beam from a set of lattice planes, separated by a distance $d$.
 Figure 3.2 · other · Thesis 3 · Iturbe 2012Cones of diffracted radiation from the incident-beam for a powder sample.
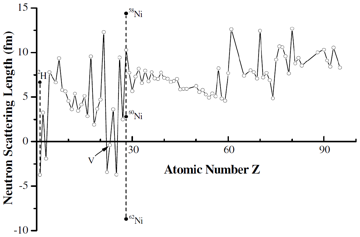 Figure 3.3 · rietveld-plot · Thesis 3 · Iturbe 2012The irregular function of neutron scattering length against atomic number. The markers joined by dashed line indicate the difference of scat…
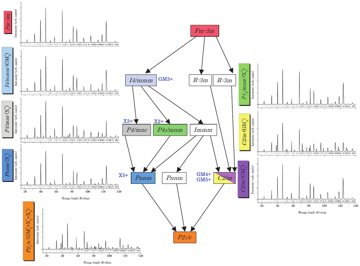 Figure 4.1 · group-subgroup-tree · Thesis 3 · Iturbe 2012Graph of maximal subgroups relating the $F m \overline{3} m$ and the $P 2_{1} / c$ space groups of room temperature $\operatorname{Sr} L n M R u \mathrm{O}_{6}(L n=\mathrm{La}, \mathrm{Nd}, \mathrm{Pr}; M=\mathrm{Zn}, \mathrm{Co}, \mathrm{Mg}, \mathrm{Ni})$…
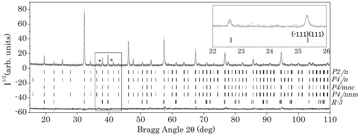 Figure 5.1 · rietveld-plot · Thesis 3 · Iturbe 2012Experimental (symbols) and calculated (line) X-ray powder-diffraction profile for the Rietveld refinement of $\mathrm{SrNdCoRuO}_{6}$ at roo…
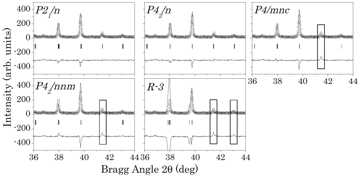 Figure 5.2 · other · Thesis 3 · Iturbe 2012Results of the XRPD data refinements, in the $36-44^{\circ} 2 \theta$ interval, in $\mathrm{SrNdCoRuO}_{6}$, using five different models wit…
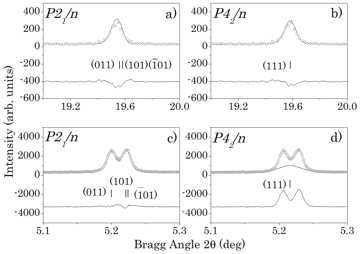 Figure 5.3 · pattern · Thesis 3 · Iturbe 2012Results of the XRPD a) and b) and SXRPD c) and d) data refinements, in the $19-20^{\circ}$ and 5.1$5.3^{\circ} 2 \theta$ interval respective…
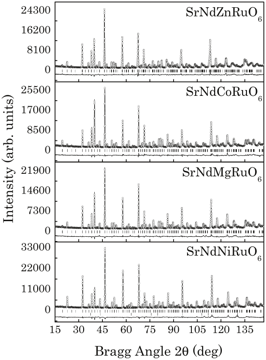 Figure 5.4 · rietveld-plot · Thesis 3 · Iturbe 2012Experimental (symbols) and calculated (line) neutron powder-diffraction profiles for the Rietveld refinement of $\mathrm{SrNd} M \mathrm{NuO}_{6}(\mathrm{M}=\mathrm{Zn}, \mathrm{Co}, \mathrm{Mg}, \mathrm{Ni})$…
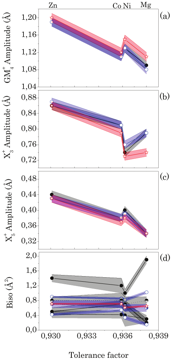 Figure 5.5 · amplitude-vs-t · Thesis 3 · Iturbe 2012Variation of (a) $\mathrm{GM}_{4}^{+}$distortion irrep amplitude (Å); (b) $\mathrm{X}_{3}^{+}$distortion irrep amplitude (Å); (c) $\mathrm{X}_{5}^{+}$…
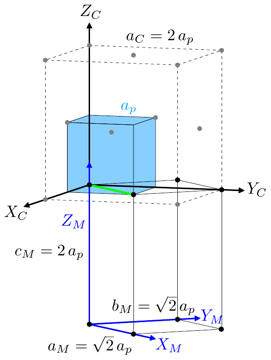 Figure 5.6 · other · Thesis 3 · Iturbe 2012Relative orientation of the unit cell of the prototype cubic simple perovskite ( $P m \overline{3} m$)(blue), of the prototype cubic double…
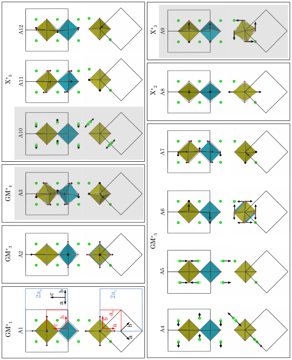 Figure 5.7 · mode-drawing · Thesis 3 · Iturbe 2012Geometrical representations of the distortion modes of the symmetry breaking from the cubic prototype phase into the monoclinic $P 2_{1} / n$…
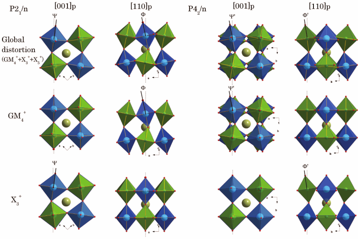 Figure 5.8 · structure-drawing · Thesis 3 · Iturbe 2012Projection along the cubic (simple) perovskite $[001]_{p}$ and $[110]_{p}$ directions, of a section of the unit cell of the double perovskit…
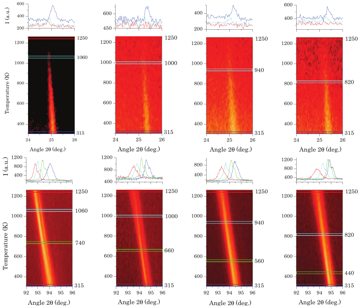 Figure 5.9 · pattern · Thesis 3 · Iturbe 2012presents the thermal evolution, from XRPD, of the scattering intensity for two $2 \theta$ intervals, corresponding to $2 \theta=24^{\circ}-26^{\circ}(111;-111)$…
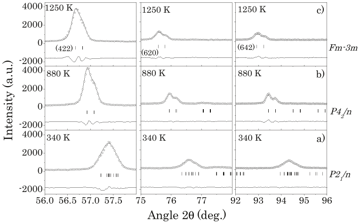 Figure 5.10 · pattern · Thesis 3 · Iturbe 2012The thermal evolution of the (422), (620) and (642) cubic reflections as determined from XRPD measurements for $\mathrm{SrNdZnRuO}_{6}$ are…
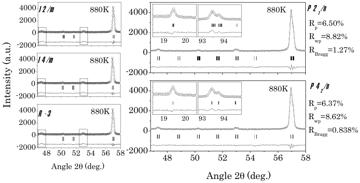 Figure 5.11 · other · Thesis 3 · Iturbe 2012Results of the XRPD data refinements at 880 K in $\mathrm{SrNdZnRuO}_{6}$, using five different models with $P 2_{1} / n, P 4_{2} / n, I 2 / m, I 4 / m$…
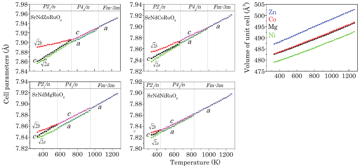 Figure 5.12 · cell-vs-t · Thesis 3 · Iturbe 2012Temperature evolution of the cell parameters and cell-volume of $\mathrm{SrNdMRuO}_{6} (M=\mathrm{Zn}, \mathrm{Co}, \mathrm{Mg}, \mathrm{Ni})$…
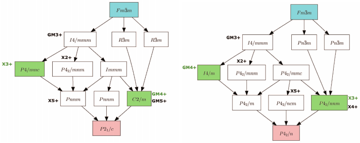 Figure 5.13 · rietveld-plot · Thesis 3 · Iturbe 2012Graph of maximal subgroups relating the space groups of the parent (highlighted in blue) and distorted $P 2_{1} / n$ and $P 4_{2} / n$ phase…
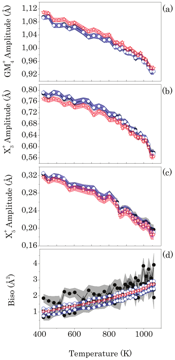 Figure 5.14 · amplitude-vs-t · Thesis 3 · Iturbe 2012Variation of (a) $\mathrm{GM}_{4}^{+}$distortion irrep amplitude $(\AA)$; (b) $\mathrm{X}_{3}^{+}$distortion irrep amplitude $(\AA)$; (c) $\mathrm{X}_{5}^{+}$…
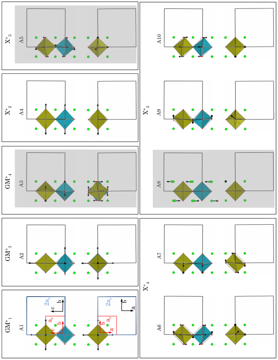 Figure 5.15 · mode-drawing · Thesis 3 · Iturbe 2012Geometrical representations of the distortion modes of the symmetry breaking from the cubic prototype phase into the tetragonal $P 4_{2} / n$…
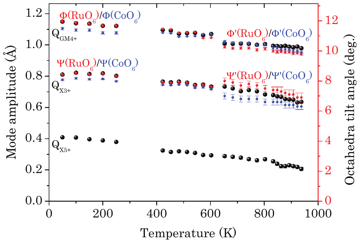 Figure 5.16 · amplitude-vs-t · Thesis 3 · Iturbe 2012and Table 5.6 exhibit the temperature evolution of the amplitude of $\mathrm{GM}_{4}^{+}$, $\mathrm{X}_{3}^{+}$and $\mathrm{X}_{5}^{+}$modes…
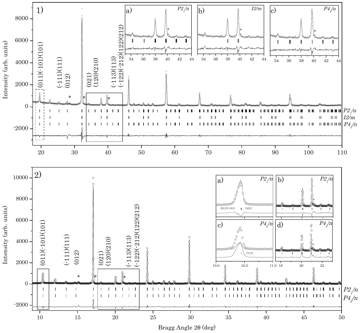 Figure 6.1 · rietveld-plot · Thesis 3 · Iturbe 2012(1)Observed (symbols), calculated (line) and difference (bottom line) XRPD ( $\lambda=1.5406 \AA$) profile for $\mathrm{SrPrMgRuO}_{6}$ at r…
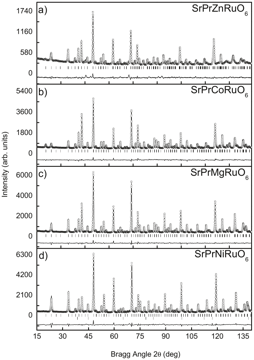 Figure 6.2 · rietveld-plot · Thesis 3 · Iturbe 2012Experimental (symbols) and calculated (line) neutron powder-diffraction profiles (D2B $\lambda=1.594 \AA)$ for the Rietveld refinement of $\mathrm{SrPr} \mathrm{MRuO}_{6}(\mathrm{M}=\mathrm{Zn}, \mathrm{Co}, \mathrm{Mg}, \mathrm{Ni})$…
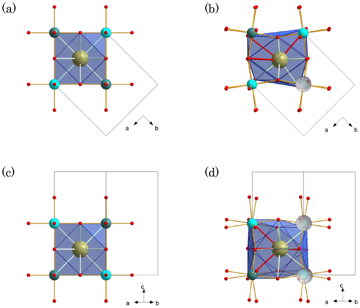 Figure 6.3 · structure-drawing · Thesis 3 · Iturbe 2012Graphical representation of (a) and (c) ideal, and (b) and (d) distorted $\mathrm{Sr} / \mathrm{PrO}_{12}$ cubooctahedral configuration (hig…
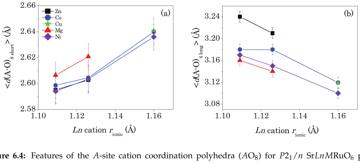 Figure 6.4 · other · Thesis 3 · Iturbe 2012Features of the $A$-site cation coordination polyhedra ( $A \mathrm{O}_{8}$) for $P 2_{1} / n \operatorname{SrLnMRuO} 6$ perovskites [115, 1…
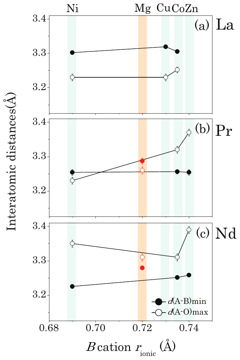 Figure 6.5 · other · Thesis 3 · Iturbe 2012$A-B$ interatomic minimum distances and $A$-O maximum distances (indicating the limit of the second coordination-sphere) for (a) lanthanum […
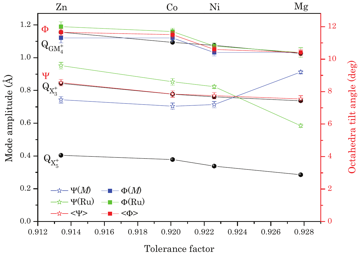 Figure 6.6 · amplitude-vs-t · Thesis 3 · Iturbe 2012Amplitudes of $\mathrm{GM}_{4}^{+}, \mathrm{X}_{3}^{+}$and $\mathrm{X}_{5}^{+}$irreps (black balls) conforming the RT phase of $\mathrm{SrPr} \mathrm{MRuO}_{6} (\mathrm{M}=\mathrm{Zn}, \mathrm{Co}, \mathrm{Mg}, \mathrm{Ni})$…
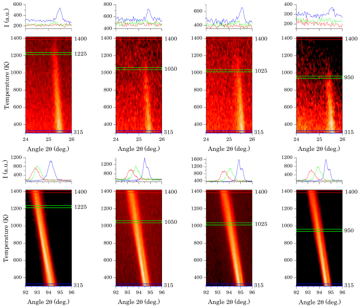 Figure 6.7 · pattern · Thesis 3 · Iturbe 2012shows the temperature dependence of the laboratory X-ray diffraction profile projections around the ( $111;-111$) monoclinic primitive refle…
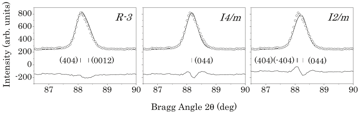 Figure 6.8 · pattern · Thesis 3 · Iturbe 2012Results of the NPD (D2B $\lambda=1.594 \AA$) data refinement, for $\mathrm{SrPrMgRuO}_{6}$ at 1123 K, using three different models with the…
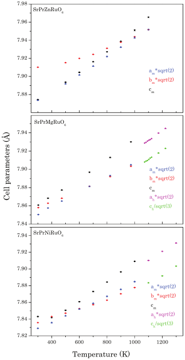 Figure 6.9 · cell-vs-t · Thesis 3 · Iturbe 2012Temperature evolution of the cell parameters of $\operatorname{SrPr} M \mathrm{MuO}_{6}(M=\mathrm{Zn}, \mathrm{Mg}, \mathrm{Ni})$ as obtaine…
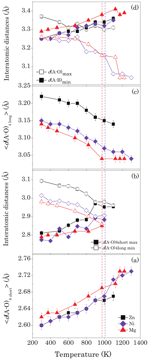 Figure 6.10 · other · Thesis 3 · Iturbe 2012Features of the $A$-site cation coordination polyhedra ( $A \mathrm{O}_{8}$) for $\operatorname{Sr} L n M R u \mathrm{O}_{6}(M=\mathrm{Zn}, \mathrm{Mg}, \mathrm{Ni})$…
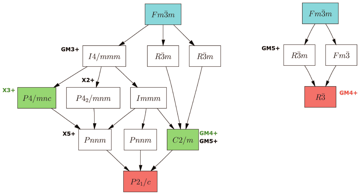 Figure 6.11 · group-subgroup-tree · Thesis 3 · Iturbe 2012Schematic of the group-subgroup chains, going from the prototype cubic symmetry (Fm $\overline{3} m$) to the room temperature space group (…
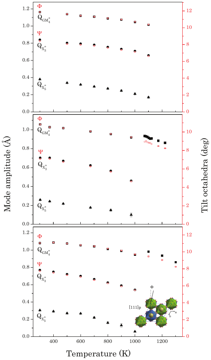 Figure 6.12 · amplitude-vs-t · Thesis 3 · Iturbe 2012Temperature dependence of the amplitudes of the modes conforming the $P 2_{1} / n$ and $R \overline{3}$ structure of $\operatorname{SrPr} M R u \mathrm{O}_{6}(M=\mathrm{Zn}($…
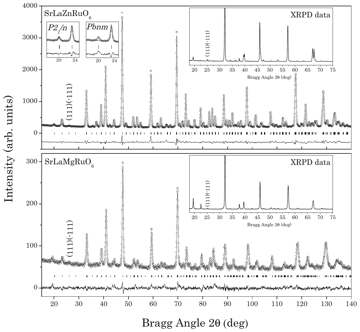 Figure 7.1 · rietveld-plot · Thesis 3 · Iturbe 2012Experimental (circles) and calculated (line) neutron diffraction profiles for the Rietveld refinements of $\mathrm{SrLaZnRuO}_{6}$ and $\mathrm{SrLaMgRuO}_{6}$…
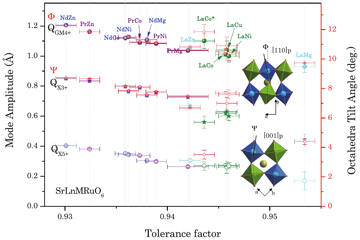 Figure 7.2 · amplitude-vs-t · Thesis 3 · Iturbe 2012Amplitudes of $\mathrm{GM}_{4}^{+}$(filled circles), $\mathrm{X}_{3}^{+}$(stars) and $\mathrm{X}_{5}^{+}$irreps (empty circles) in the RT st…
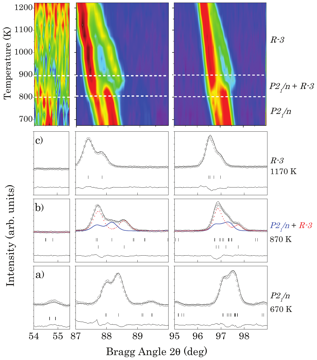 Figure 7.3 · rietveld-plot · Thesis 3 · Iturbe 2012Temperature evolution of $54-55.5^{\circ}$ (primitive peak, (-311;311;-131;131)), 87.8-90 ${ }^{\circ}$ (cubic (444) reflection) and $95-99^{\circ}$…
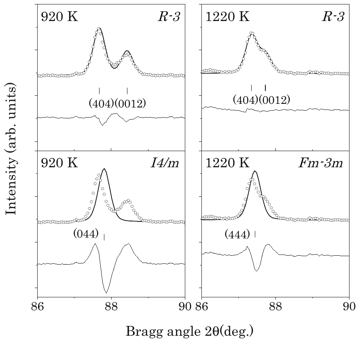 Figure 7.4 · pattern · Thesis 3 · Iturbe 2012Refinements results for $\mathrm{SrLaZnRuO}_{6}$, in the 86-90 ${ }^{\circ} 2 \theta$ interval at 920 and 1220 K temperatures, using differe…
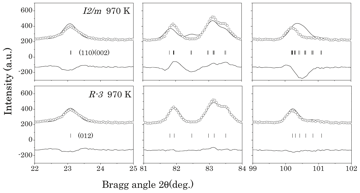 Figure 7.5 · pattern · Thesis 3 · Iturbe 2012Refinements results for $\mathrm{SrLaZnRuO}_{6}$, in the $22-25^{\circ}$ (cubic (200) reflection), $81-84^{\circ}$ (cubic (533) and (622) re…
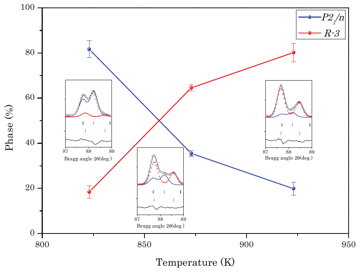 Figure 7.6 · rietveld-plot · Thesis 3 · Iturbe 2012Temperature evolution of the concentration of the $P 2_{1} / n$ (blue) and $R \overline{3}$ (red) phases in the co-existence range for $\mathrm{SrLaZnRuO}_{6}$…
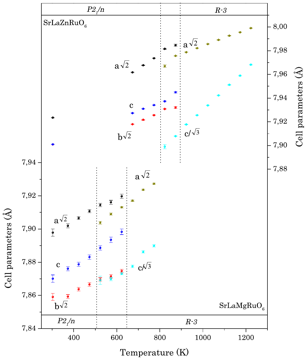 Figure 7.7 · cell-vs-t · Thesis 3 · Iturbe 2012Variation of the cell parameters for $\mathrm{SrLaZnRuO}_{6}$ and $\mathrm{SrLaMgRuO}_{6}$ with the temperature. Dashed lines indicate the c…
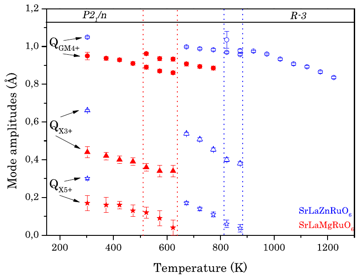 Figure 7.8 · amplitude-vs-t · Thesis 3 · Iturbe 2012Temperature evolution of the $\mathrm{GM}_{4}^{+}, \mathrm{X}_{3}^{+}$and $\mathrm{X}_{5}^{+}$mode amplitudes, as obtained from refinement o…
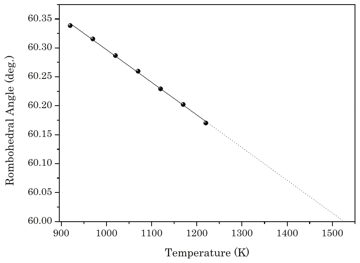 Figure 7.9 · other · Thesis 3 · Iturbe 2012Temperature dependence of the rhombohedral angle $\alpha$ for $\mathrm{SrLaZnRuO}_{6}$. The solid line is a linear fit to the experimental p…
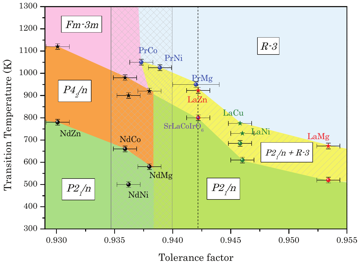 Figure 7.10 · phase-diagram · Thesis 3 · Iturbe 2012Experimentally calculated tolerance factor and temperature dependence phase diagram of $\mathrm{SrLaMRuO}_{6}(\mathrm{M}=\mathrm{Zn}[\mathrm{PW}], \mathrm{Cu}[116], \mathrm{Mg}[\mathrm{PW}], \mathrm{Ni}[116]), \mathrm{SrNdMRuO}_{6}(\mathrm{M}=\mathrm{Zn}, \mathrm{Co}, \mathrm{Mg}, \mathrm{Ni})[120]$…
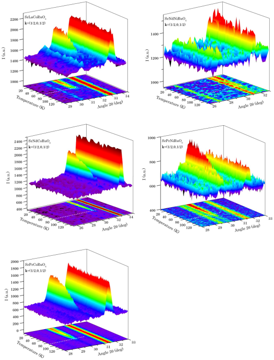 Figure 8.1 · pattern · Thesis 3 · Iturbe 2012Thermal variation of the NPD patterns acquired with $\lambda=2.52 \AA$ in the temperature range $10
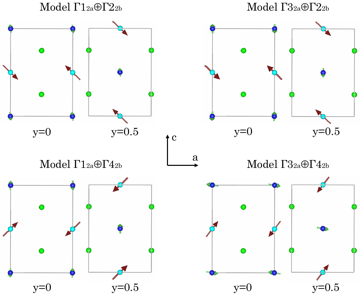 Figure 8.2 · magnetization · Thesis 3 · Iturbe 2012Spin directions in a fitted magnetic models for $\mathrm{SrLaCoRuO}_{6}$. The moments lie in the (010) plane. $\mathrm{Co} / \mathrm{Ru}$ at…
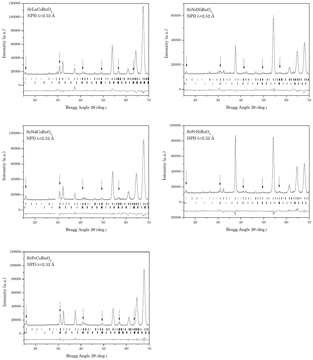 Figure 8.3 · rietveld-plot · Thesis 3 · Iturbe 2012Observed (circles), calculated (full line), and difference NPD (D1B, $\lambda=2.52 \AA$) Rietveld profiles for $\mathrm{SrLaCoRuO}_{6}, \mathrm{SrNdCoRuO}_{6}, \mathrm{SrPrCoRuO}_{6}, \mathrm{SrNdNiRuO}_{6}$…
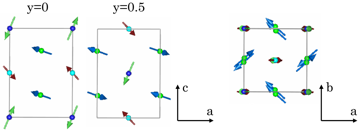 Figure 8.4 · structure-drawing · Thesis 3 · Iturbe 2012Possible magnetic model of the final refined $\left(3 \Gamma 1_{2 a} \oplus 3 \Gamma 2_{2 b} \oplus 3 \Gamma 1_{4 e}\right)$ magnetic struct…
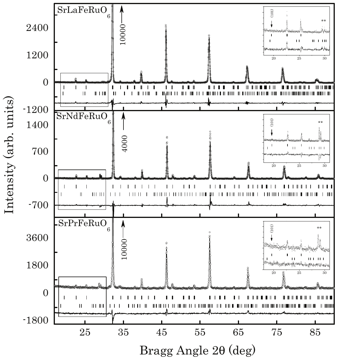 Figure 9.1 · rietveld-plot · Thesis 3 · Iturbe 2012Experimental (symbols) and calculated (line) X-ray powder-diffraction profiles for the Rietveld refinement of $\mathrm{SrLnFeRuO}_{6}(\mathrm{Ln}=\mathrm{La}, \mathrm{Nd}, \mathrm{Pr})$…
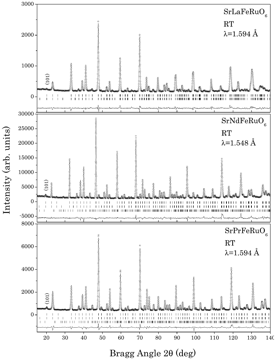 Figure 9.2 · rietveld-plot · Thesis 3 · Iturbe 2012Experimental (symbols) and calculated (line) neutron powder-diffraction profiles for the Rietveld refinement of $\mathrm{SrLnFeRuO}_{6}(\mathrm{Ln}=\mathrm{La}, \mathrm{Nd}, \mathrm{Pr})$…
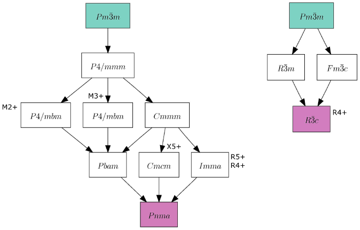 Figure 9.3 · group-subgroup-tree · Thesis 3 · Iturbe 2012Graph of maximal subgroups relating the space group of the archetype (high lighted in blue) and distorted Pbnm and R $\overline{3}$ phase (h…
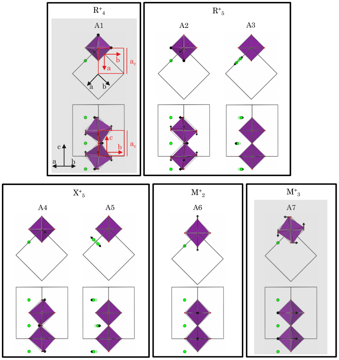 Figure 9.4 · structure-drawing · Thesis 3 · Iturbe 2012Schematic representation of the five irrep distortions allowed in the Pbnm configuration, corresponding to $\mathrm{M}_{2}^{+}, \mathrm{M}_{3}^{+}, \mathrm{R}_{4}^{+}, \mathrm{R}_{5}^{+}$…
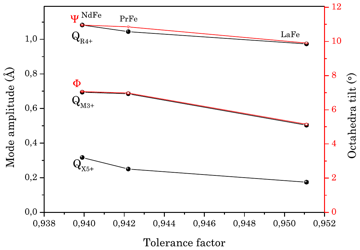 Figure 9.5 · amplitude-vs-t · Thesis 3 · Iturbe 2012Amplitudes of $\mathrm{R}_{4}^{+}, \mathrm{M}_{3}^{+}$and $\mathrm{X}_{5}^{+}$irreps conforming the RT phase of the $\mathrm{SrLaFeRuO}_{6}$…
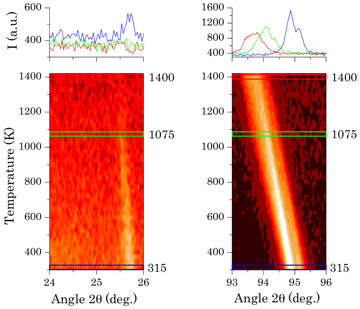 Figure 9.6 · pattern · Thesis 3 · Iturbe 2012Thermal evolution of the (111) primitive peak and (321) cubic reflections of $\mathrm{SrPrFeRuO}_{6}$ obtained from XRPD experiment. The sca…
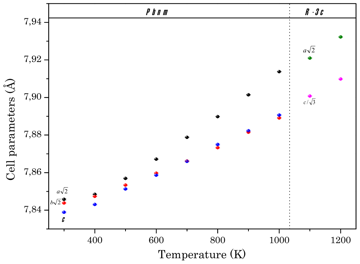 Figure 9.7 · cell-vs-t · Thesis 3 · Iturbe 2012Temperature evolution of the cell parameters of $\mathrm{SrPrFeRuO}_{6}$ as obtained from the NPD measurements: cell parameters of the ortho…
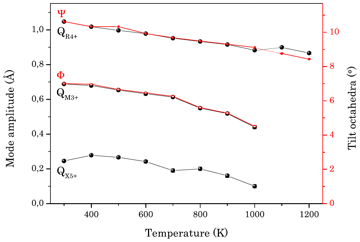 Figure 9.8 · amplitude-vs-t · Thesis 3 · Iturbe 2012Temperature dependence of the amplitudes of the irreps conforming the $P b n m$ and $R \overline{3} c$ structure of $\mathrm{SrPrFeRuO}_{6}$…
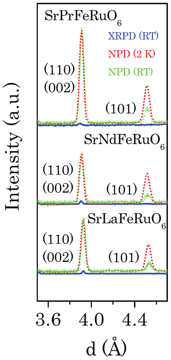 Figure 9.9 · pattern · Thesis 3 · Iturbe 2012XRPD data at RT (blue line), NPD data at 2 K (red dotted line) and RT (green crossed line) in d space (in Å). All patterns are re-normalized…
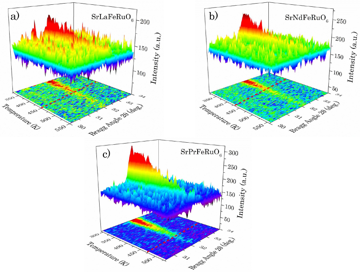 Figure 9.10 · pattern · Thesis 3 · Iturbe 2012Thermal evolution of the (101) reflection of (a) $\mathrm{SrLaFeRuO}_{6}$, (b) $\mathrm{SrNdFeRuO}_{6}$ and (c) SrPrFeRuO $\mathrm{O}_{6}$ c…
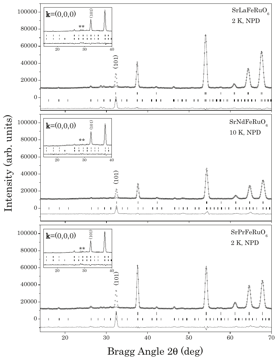 Figure 9.11 · rietveld-plot · Thesis 3 · Iturbe 2012Low angle region of the neutron powder diffraction patterns collected at low temperature, including the observed intensity (open circles), c…
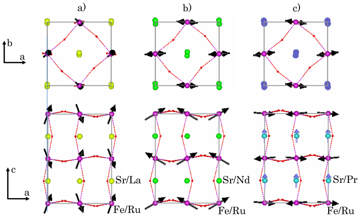 Figure 9.12 · structure-drawing · Thesis 3 · Iturbe 2012Magnetic structure models, a) $\mathrm{SrLaFeRuO}_{6}, 3 \Gamma_{5}$ solution; b) $\mathrm{SrNdFeRuO}_{6}, 3 \Gamma_{3}$ solution; and c) $\mathrm{SrPrFeRuO}_{6}, 3 \Gamma_{3} \oplus 1 \Gamma_{3}$…
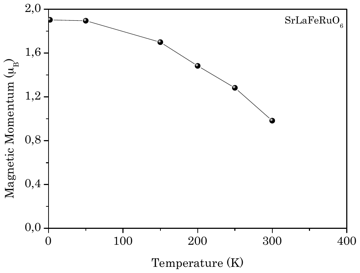 Figure 9.13 · magnetization · Thesis 3 · Iturbe 2012Temperature dependance of $\mathrm{SrLaFeRuO}_{6} 4 a$ site $\mathrm{Fe} / \mathrm{Ru}$ magnetic momentum for $3 \Gamma_{5}$ solution.
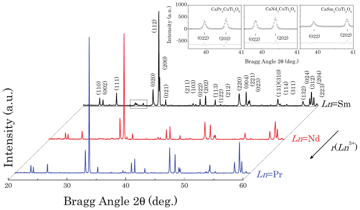 Figure 10.1 · pattern · Thesis 3 · Iturbe 2012X-ray powder diffraction patterns $(\lambda=1.5406 \AA)$ for $\mathrm{CaLn}_{2} \mathrm{CuTi}_{2} \mathrm{O}_{9}(L n=\mathrm{Pr}, \mathrm{Nd}, \mathrm{Sm})$…
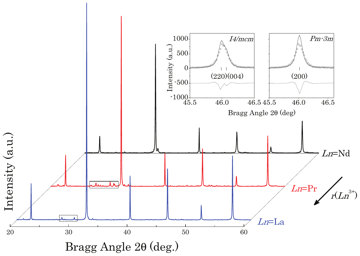 Figure 10.2 · rietveld-plot · Thesis 3 · Iturbe 2012X -ray powder diffraction patterns $(\lambda=1.5406 \AA)$ for $\mathrm{BaLn}_{2} \mathrm{CuTi}_{2} \mathrm{O}_{9}(L n=\mathrm{La}, \mathrm{Pr}, \mathrm{Nd})$…
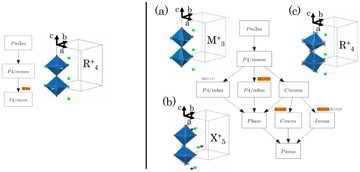 Figure 10.3 · group-subgroup-tree · Thesis 3 · Iturbe 2012Graph of maximal subgroups connecting the space group $P m \overline{3} m$ and its subgroups (left) I4/mcm (ITA No.140) and (right) Pbnm (IT…
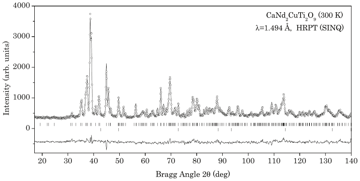 Figure 10.4 · rietveld-plot · Thesis 3 · Iturbe 2012Observed ( $\circ$), calculated ( -), and difference of neutron powder diffraction ( $\lambda=1.494 \AA$) Rietveld profiles for $\mathrm{CaNd}_{2} \mathrm{CuTi}_{2} \mathrm{O}_{9}$…
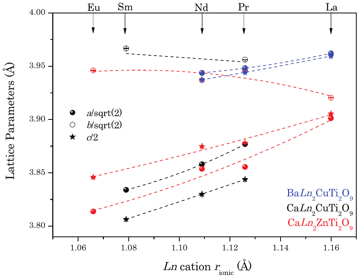 Figure 10.5 · cell-vs-t · Thesis 3 · Iturbe 2012Reduced cell parameters as a function of the lanthanide cation ionic radius for $\mathrm{CaLn}_{2} \mathrm{CuTi}_{2} \mathrm{O}_{9}(L n=\mathrm{Pr}, \mathrm{Nd}, \mathrm{Sm})($…
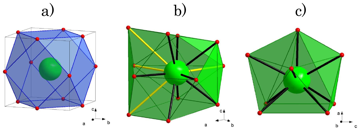 Figure 10.6 · structure-drawing · Thesis 3 · Iturbe 2012The coordination polyhedron for $\mathrm{Ca} / \mathrm{Ln}$ cations occupying the $A$-site of the $A B \mathrm{O}_{3}$ perovskite; (a) ideal…
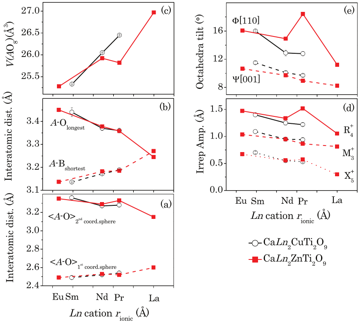 Figure 10.7 · amplitude-vs-t · Thesis 3 · Iturbe 2012Variation of (a) mean $A-\mathrm{O}$ bond lengths ( $\AA$) for first coordination sphere ( $(1)$) and second coordination sphe…
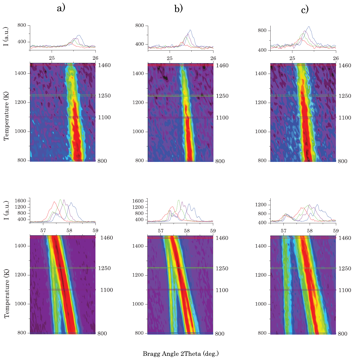 Figure 10.8 · structure-drawing · Thesis 3 · Iturbe 2012Extracts from the laboratory X-ray diffraction ( $\lambda_{\mathrm{K} \alpha 1}=1.5406 \AA$ and $\lambda_{\mathrm{K} \alpha 2}=1.5444 \AA$)…
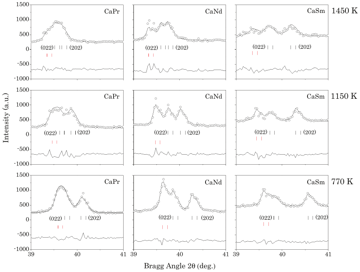 Figure 10.9 · pattern · Thesis 3 · Iturbe 2012Portion of the laboratory X -ray powder diffraction ( $\lambda_{\mathrm{K} \alpha 1}=1.5406 \AA$ and $\lambda_{\mathrm{K} \alpha 2}=1.5444 \AA$…
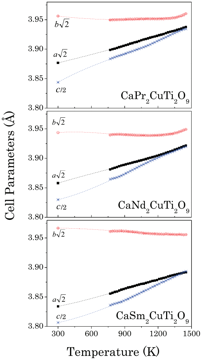 Figure 10.10 · cell-vs-t · Thesis 3 · Iturbe 2012Variation of the reduced cell parameters in the orthorhombic phase (space group Pbnm) with temperature for $\mathrm{CaLn}_{2} \mathrm{CuTi}_{2} \mathrm{O}_{9}(L n=\mathrm{Pr}, N d, S m)$…
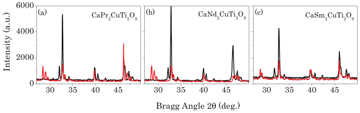 Figure 10.11 · pattern · Thesis 3 · Iturbe 2012X-ray powder diffraction patterns for (a) $\mathrm{CaPr}_{2} \mathrm{CuTi}_{2} \mathrm{O}_{9}$, (b) $\mathrm{CaNd}_{2} \mathrm{CuTi}_{2} \mathrm{O}_{9}$…
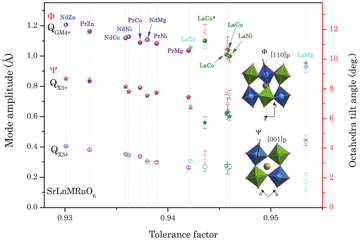 Figure 10.12 · amplitude-vs-t · Thesis 3 · Iturbe 2012Amplitudes of $\mathrm{GM}_{4}^{+}$(fill circles), $\mathrm{X}_{3}^{+}$(stars) and $\mathrm{X}_{5}^{+}$irreps (empty circles) conforming the…
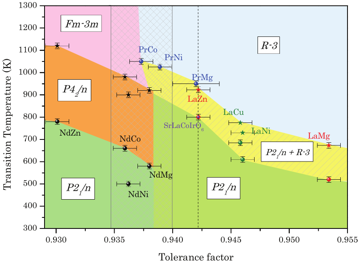 Figure 10.13 · phase-diagram · Thesis 3 · Iturbe 2012Tolerance factor and temperature dependence phase diagram of $\mathrm{SrLaMRuO}_{6} (\mathrm{M}=\mathrm{Zn}(\mathrm{PW}), \mathrm{Cu}[116], \mathrm{Mg}(\mathrm{PW}), \mathrm{Ni}[116]), \quad \mathrm{SrNdMRuO}_{6} \quad(\mathrm{M}=\mathrm{Zn}, \mathrm{Co}, \mathrm{Mg}, \mathrm{Ni}) \quad[120] \quad$…
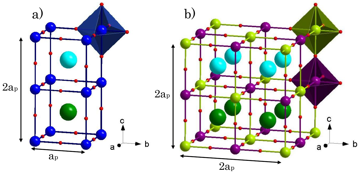 Figure 10.14 · other · Thesis 3 · Iturbe 2012Cation ordering schemes for $A$-site 2D (layered) ordering in $A A^{\prime} B B^{\prime} \mathrm{O}_{6}$ perovskites, $B$ and $B^{\prime}$ c…
 Figure p209-2497 · other · Thesis 3 · Iturbe 2012(no caption found; uncaptioned image)
 Figure p214-2641 · other · Thesis 3 · Iturbe 2012(no caption found; uncaptioned image)
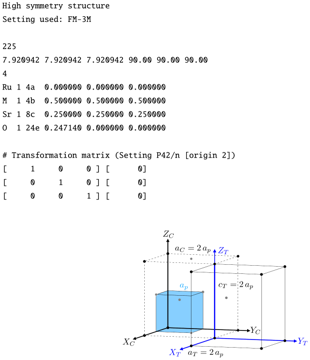 Figure p215-2648 · other · Thesis 3 · Iturbe 2012(no caption found; uncaptioned image)
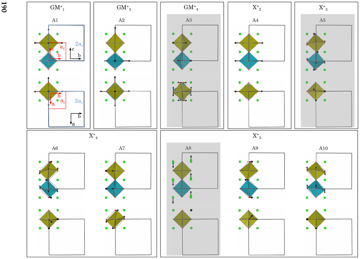 Figure p218-2687 · other · Thesis 3 · Iturbe 2012(no caption found; uncaptioned image)
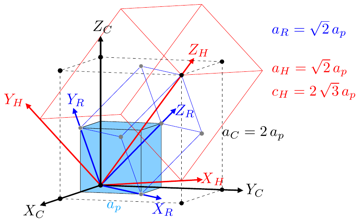 Figure p219-2723 · other · Thesis 3 · Iturbe 2012(no caption found; uncaptioned image)
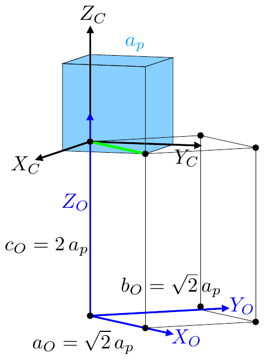 Figure p223-2813 · other · Thesis 3 · Iturbe 2012(no caption found; uncaptioned image)
 Figure p227-2904 · other · Thesis 3 · Iturbe 2012(no caption found; uncaptioned image)
 Figure p228-2930 · other · Thesis 3 · Iturbe 2012(no caption found; uncaptioned image)
 Figure p231-2980 · other · Thesis 3 · Iturbe 2012(no caption found; uncaptioned image)
 Figure p242-3315 · other · Thesis 3 · Iturbe 2012(no caption found; uncaptioned image)
 Figure p242-3318 · other · Thesis 3 · Iturbe 2012(no caption found; uncaptioned image)
 Figure p242-3321 · other · Thesis 3 · Iturbe 2012(no caption found; uncaptioned image)
 Figure p243-3336 · other · Thesis 3 · Iturbe 2012(no caption found; uncaptioned image)
 Figure p244-3350 · other · Thesis 3 · Iturbe 2012(no caption found; uncaptioned image)
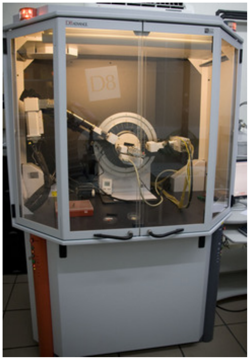 Figure p245-3367 · other · Thesis 3 · Iturbe 2012(no caption found; uncaptioned image)
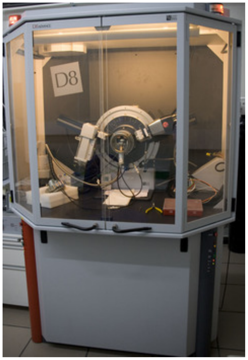 Figure p246-3383 · other · Thesis 3 · Iturbe 2012(no caption found; uncaptioned image)
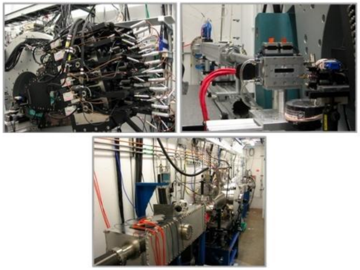 Figure p247-3401 · other · Thesis 3 · Iturbe 2012(no caption found; uncaptioned image)
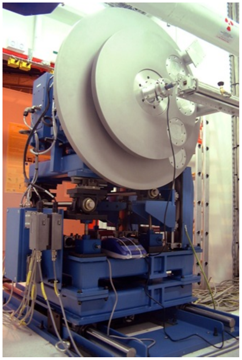 Figure p248-3417 · other · Thesis 3 · Iturbe 2012(no caption found; uncaptioned image)
 Figure p249-3447 · other · Thesis 3 · Iturbe 2012(no caption found; uncaptioned image)
 Figure p250-3476 · other · Thesis 3 · Iturbe 2012(no caption found; uncaptioned image)
 Figure p251-3505 · other · Thesis 3 · Iturbe 2012(no caption found; uncaptioned image)
 Figure p252-3526 · other · Thesis 3 · Iturbe 2012(no caption found; uncaptioned image)
 Figure p259-3714 · other · Thesis 3 · Iturbe 2012(no caption found; uncaptioned image)
 Figure p259-3717 · other · Thesis 3 · Iturbe 2012(no caption found; uncaptioned image)
 Figure p260-3722 · other · Thesis 3 · Iturbe 2012(no caption found; uncaptioned image)
 Figure p260-3725 · other · Thesis 3 · Iturbe 2012(no caption found; uncaptioned image)
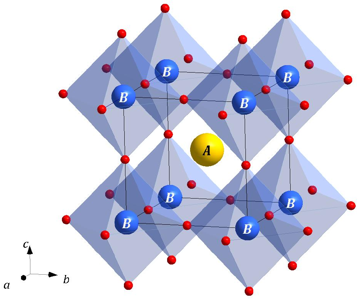 Figure 1.1 · structure-drawing · Thesis 4 · Orayech 2015The schematic representation of the cubic simple perovskite structure $A B O_{3}$. The $A$ and $B$ cations are shown as yellow and blue sphe…
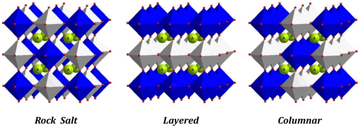 Figure 1.2 · other · Thesis 4 · Orayech 2015Cation ordering schemes in perovskites. From left to the right: rock salt, layered and columnar ordering are shown for $B$-site ordering in…
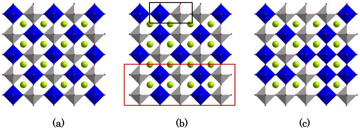 Figure 1.3 · structure-drawing · Thesis 4 · Orayech 2015Types of ordering in perovskites with two different $B$-site cations. (a) Ideal rock-salt ordering; (b) partial rock-salt ordering with loca…
 Figure p1-9 · other · Thesis 4 · Orayech 2015(no caption found; uncaptioned image)
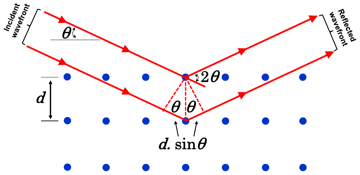 Figure 3.1 · other · Thesis 4 · Orayech 2015Geometrical illustration of the Braggs' law.
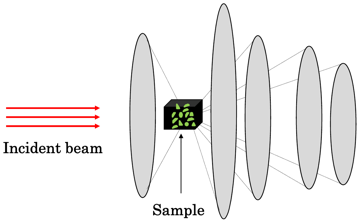 Figure 3.2 · other · Thesis 4 · Orayech 2015The schematic of the powder diffraction cones produced by a polycrystalline sample while its interaction with an incident-beam.
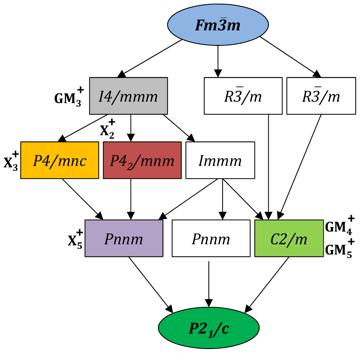 Figure 4.1 · group-subgroup-tree · Thesis 4 · Orayech 2015Graph of maximal subgroups relating the $F m \overline{3} m$ and the $P 2_{1} / c$ space groups of room temperature $\mathrm{Sr}_{2} M \mathrm{SbO}_{6}(M=L n, Y$…
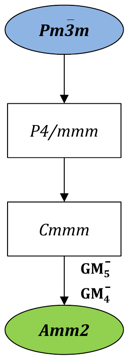 Figure 4.2 · group-subgroup-tree · Thesis 4 · Orayech 2015Graph of maximal subgroups relating the $P m \overline{3} m$ and the $A m m 2$ space groups of room temperature $\mathrm{Na}_{0.5} \mathrm{K}_{0.5} \mathrm{O}_{3}$…
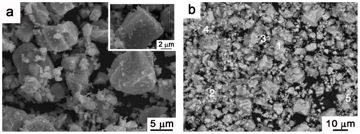 Figure 5.1 · tem · Thesis 4 · Orayech 2015a shows the general aspect of the powder sample. Two different types of particles can be observed: large particles of about $2-8 \mu m$ and…
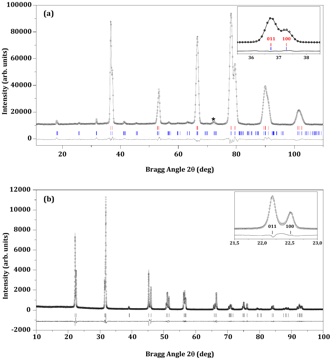 Figure 5.2 · rietveld-plot · Thesis 4 · Orayech 2015Experimental (symbols) and calculated (line) a) neutron and b) X-ray profiles for the Rietveld refinement of $\mathrm{Na}_{0.5} \mathrm{K}_{0.5} \mathrm{NbO}_{3}$…
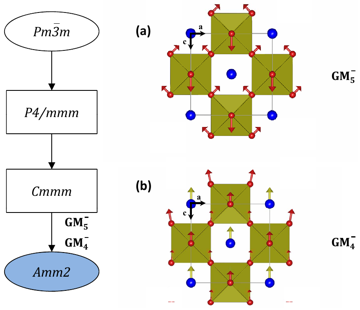 Figure 5.3 · structure-drawing · Thesis 4 · Orayech 2015To the left, chain of maximal sub-groups of $P m \overline{3} m$ space group down-to the experimentally observed room-temperature $A m m 2$…
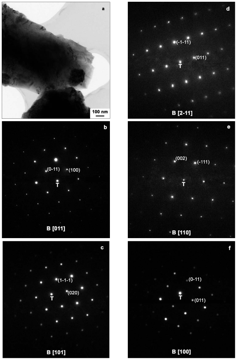 Figure 5.4 · tem · Thesis 4 · Orayech 2015a) Bright field TEM micrograph of a typical particle in the sample. b), d) and e) SAD patterns acquired along the [011], [2-11] and [110] zo…
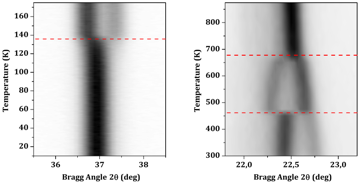 Figure 5.5 · pattern · Thesis 4 · Orayech 2015Thermal evolution at low-temperatures from NPD measurements (to the left) of the 101 rhombohedral reflection, and at high-temperatures from…
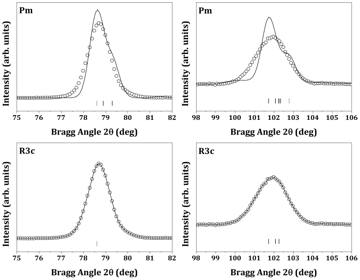 Figure 5.6 · other · Thesis 4 · Orayech 2015Results of the refinements, in the $75^{\circ}-82^{\circ} 2 \theta$ and $98^{\circ}-106^{\circ} 2 \theta$ intervals, in $\mathrm{Na}_{0.5} \mathrm{K}_{0.5} \mathrm{NbO}_{3}$…
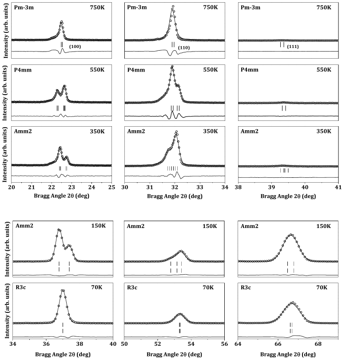 Figure 5.7 · pattern · Thesis 4 · Orayech 2015Portion of (a) NPD and (b) XRPD profiles for $\mathrm{Na}_{0.5} \mathrm{K}_{0.5} \mathrm{NbO}_{3}$ showing, at selected temperatures $70,150,350,550$…
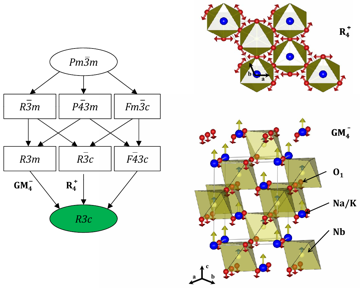 Figure 5.8 · structure-drawing · Thesis 4 · Orayech 2015To the left, chain of maximal sub-groups of $P m \overline{3} m$ parent phase space group down-to the experimentally observed low-temperatur…
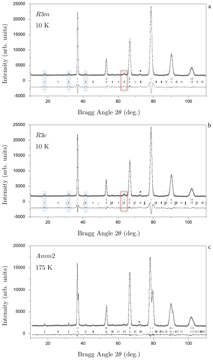 Figure 5.9 · rietveld-plot · Thesis 4 · Orayech 2015Experimental (symbols) and calculated (line) neutron profiles for the Rietveld refinement of $\mathrm{Na}_{0.5} \mathrm{K}_{0.5} \mathrm{NbO}_{3}$…
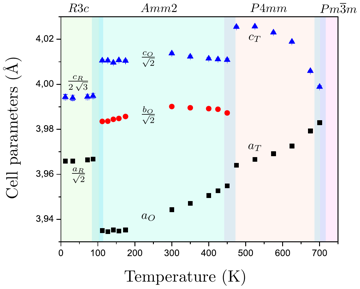 Figure 5.10 · cell-vs-t · Thesis 4 · Orayech 2015Thermal evolution of the lattice parameters of $\mathrm{Na}_{0.5} \mathrm{K}_{0.5} \mathrm{NbO}_{3}$, as obtained from XRPD and NPD measurem…
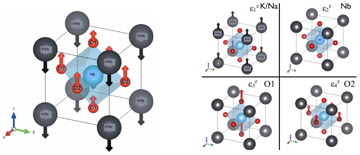 Figure 5.11 · mode-drawing · Thesis 4 · Orayech 2015(a) Relative atomic displacements with respect to the cubic structure, in the P4mm phase: those define polar distortion mode. (b) The four b…
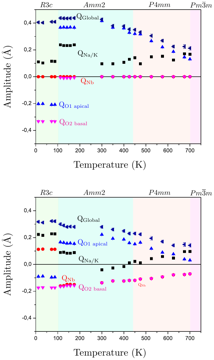 Figure 5.12 · amplitude-vs-t · Thesis 4 · Orayech 2015(a) Results from the conventional symmetry adapted modes' amplitude refinements. See the text for details. (b) The structures obtained after…
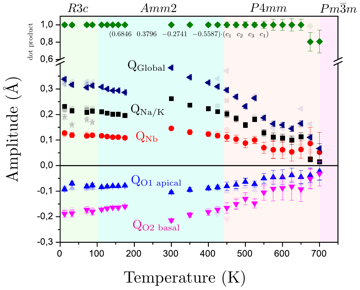 Figure 5.13 · amplitude-vs-t · Thesis 4 · Orayech 2015Results of the parameterized refinement. For further discussion, see the text. The dimmed symbols show the results obtained for the first pa…
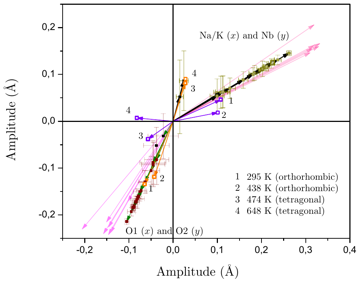 Figure 5.14 · amplitude-vs-t · Thesis 4 · Orayech 2015Evolution with temperature of the tetra-vector, but split in two parts: amplitudes of the modes $\mathrm{Na} / \mathrm{K}(x)$ versus those o…
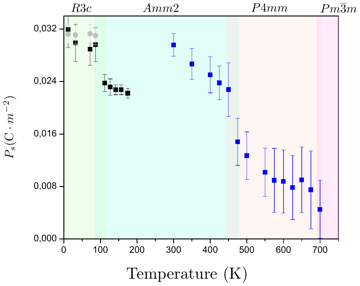 Figure 5.15 · structure-drawing · Thesis 4 · Orayech 2015Calculated SP (see the text for further details). Different colours represent the points of the SP resulting from the data of different sour…
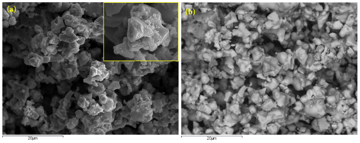 Figure 6.1 · tem · Thesis 4 · Orayech 2015(a) Secondary electron image showing the overall appearance of the powder sample. The inset shows an enlargement of a particle. (b) Back-sca…
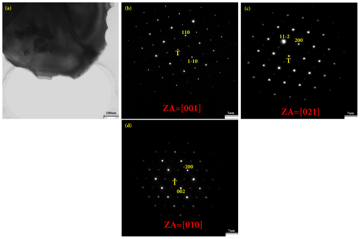 Figure 6.2 · tem · Thesis 4 · Orayech 2015(a) Bright field image of electron transparent area of one particle. (b) Selected area electron diffraction pattern acquired along the [001]…
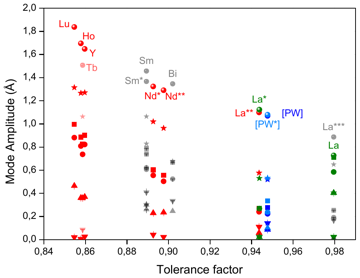 Figure 6.3 · amplitude-vs-t · Thesis 4 · Orayech 2015Amplitudes of $\mathrm{GM}_{4}^{+}$(spheres), $\mathrm{X}_{3}^{+}$(stars), the global amplitude-value for the tri-dimensional $\mathrm{X}_{5}^{+}$…
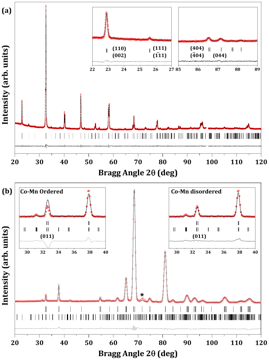 Figure 6.4 · rietveld-plot · Thesis 4 · Orayech 2015Experimental (symbols) and calculated (line) (a) X-ray profiles and (b) neutron profiles from the Rietveld refinements of $\mathrm{La}_{2} \mathrm{CoMnO}_{6}$…
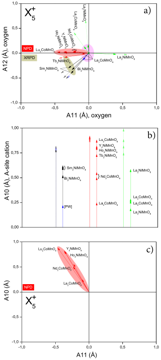 Figure 6.5 · amplitude-vs-t · Thesis 4 · Orayech 2015Two dimensional sections showing the mode-amplitudes of the three dimensional space transforming according to the $\mathrm{X}_{5}^{+}$irrep.…
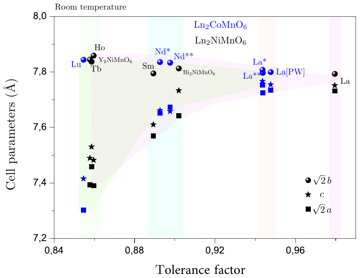 Figure 6.6 · cell-vs-t · Thesis 4 · Orayech 2015Evolution, at room temperature, of the cell parameters along the analyzed structures in the families: $\mathrm{Ln}_{2} \mathrm{CoMnO}_{6}$ (…
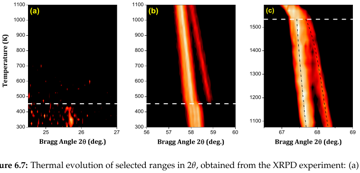 Figure 6.7 · pattern · Thesis 4 · Orayech 2015Thermal evolution of selected ranges in $2 \theta$, obtained from the XRPD experiment: (a) $24.5-27^{\circ}$, corresponding to the (111) pri…
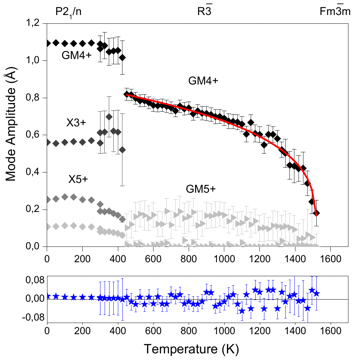 Figure 6.8 · rietveld-plot · Thesis 4 · Orayech 2015Temperature evolution of the amplitudes of the modes breaking the symmetry from the cubic to the $P 2_{1} / n$ and $R \overline{3}$ symmetri…
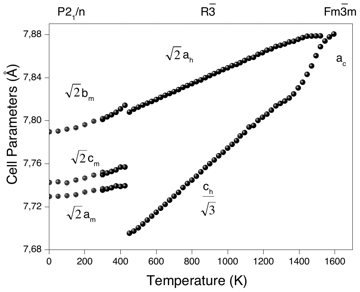 Figure 6.9 · cell-vs-t · Thesis 4 · Orayech 2015Variation with temperature of the lattice parameters for $\mathrm{La}_{2} \mathrm{CoMnO}_{6}$, as obtained from the NPD (2-300 K)(dimmed bla…
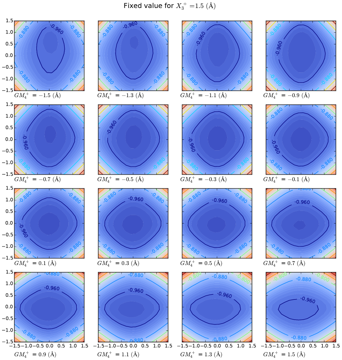 Figure 7.1 · amplitude-vs-t · Thesis 4 · Orayech 2015Energy projections, in the $\mathrm{X} 5+$ two-dimensional space (A10, A11), for a fixed value of $\mathrm{X}_{3}^{+}$as indicated and for t…
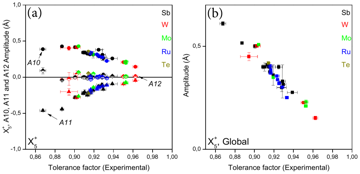 Figure 7.2 · amplitude-vs-t · Thesis 4 · Orayech 2015(a) Evolution with the tolerance factor of the partial distortion of the $\mathrm{Sr}_{2} \mathrm{MM}^{\prime} \mathrm{O}_{6}$ given by the…
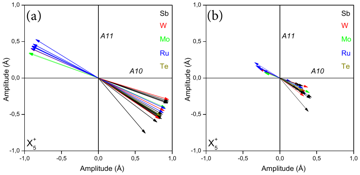 Figure 7.3 · amplitude-vs-t · Thesis 4 · Orayech 2015(a) Representation of the $\mathrm{X}_{5}^{+}$direction given by the components $c 1$ et $c 2$ for the $\mathrm{Sr}_{2} \mathrm{MM}^{\prime} \mathrm{O}_{6}$…
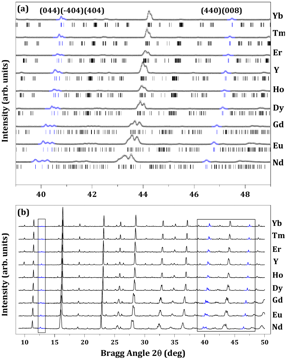 Figure 8.1 · pattern · Thesis 4 · Orayech 2015(a) Evolution of the synchrotron X-ray powder diffraction patterns at room temperature of the $\mathrm{Sr}_{2} \mathrm{MSbO}_{6}(\mathrm{M}=\mathrm{Ln}, \mathrm{Y})$…
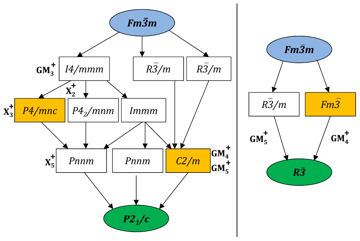 Figure 8.2 · rietveld-plot · Thesis 4 · Orayech 2015Graph of maximal subgroups relating the space groups of the parent phase (highlighted in blue) and distorted phase (highlighted in green) of…
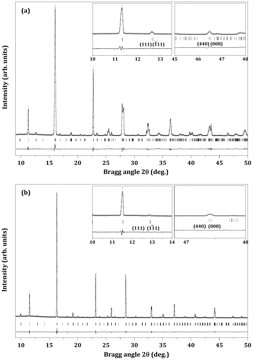 Figure 8.3 · rietveld-plot · Thesis 4 · Orayech 2015Experimental and calculated powder diffraction profiles for the Rietveld refinement of $\mathrm{Sr}_{2} \mathrm{NdSbO}_{6}$ (a) and $\mathrm{Sr}_{2} \mathrm{YbSbO}_{6}$…
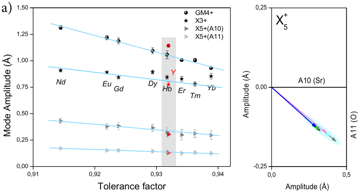 Figure 8.4 · amplitude-vs-t · Thesis 4 · Orayech 2015a): Amplitudes of $\mathrm{GM}_{4}^{+}, \mathrm{X}_{3}^{+}$and $\mathrm{X}_{5}^{+}$irreps consolidating the RT phases of $\mathrm{Sr}_{2} \mathrm{MSbO}_{6} \mathrm{M}=\mathrm{Ln}$…
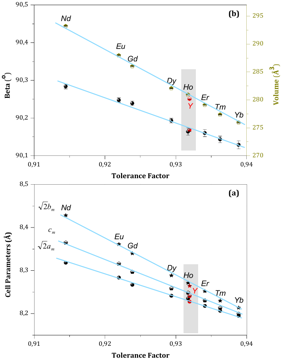 Figure 8.5 · cell-vs-t · Thesis 4 · Orayech 2015Evolution, as a function of the tolerance factor increasing of the unit-cell parameters (a), the unit-cell volume (b) and the monoclinic ang…
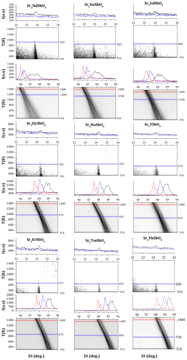 Figure 8.6 · pattern · Thesis 4 · Orayech 2015Thermal evolution of the $22-26^{\circ} 2 \theta$ interval, corresponding to the monoclinic primitive reflections (-111) and (111) (top) whi…
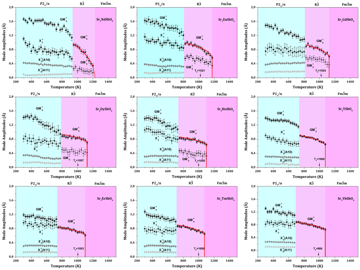 Figure 8.7 · amplitude-vs-t · Thesis 4 · Orayech 2015Temperature evolution of the amplitudes of some of the symmetry adapted modes in $P 2_{1} / n$ and $R \overline{3}$, as obtained from the XR…
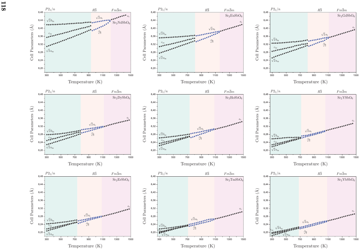 Figure 8.8 · cell-vs-t · Thesis 4 · Orayech 2015Temperature evolution of the lattice parameters of $\mathrm{Sr}_{2} \mathrm{MSbO}_{6}$. The cell parameters of the trigonal phase are shown…
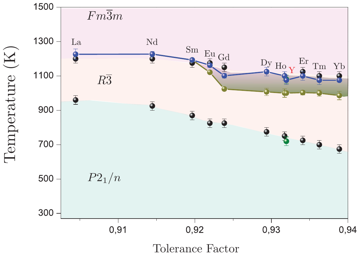 Figure 8.9 · phase-diagram · Thesis 4 · Orayech 2015Phase diagram (phase transition temperatures versus tolerance factors) for the $\mathrm{Sr}_{2} \mathrm{MSbO}_{6}$ ( $\mathrm{M}=\mathrm{Ln}, \mathrm{Y}$…
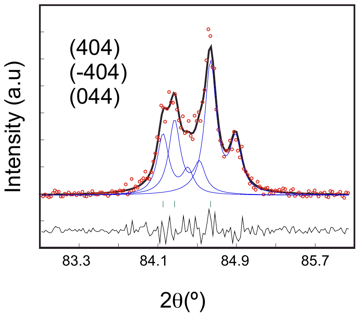 Figure 9.1 · pattern · Thesis 4 · Orayech 2015Splitting of the singlet cubic reflection (444) ${ }_{\mathrm{c}}$ into a triplet: (404), (-404) and (044) reflections. The plot shows a fit…
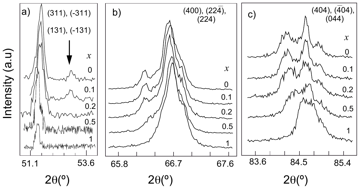 Figure 9.2 · pattern · Thesis 4 · Orayech 2015Selected $2 \theta$ intervals for the four compositions of the $\mathrm{Sr}_{2} \mathrm{Co}_{1-x} \mathrm{Mg}_{x} \mathrm{TeO}_{6}$ series.…
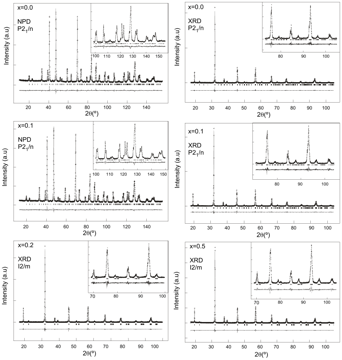 Figure 9.3 · rietveld-plot · Thesis 4 · Orayech 2015Experimental (symbols) and calculated (line) X-ray profiles and neutron profiles for the Rietveld refinement of the $\mathrm{Sr}_{2} \mathrm{Co}_{1-x} \mathrm{Mg}_{x} \mathrm{TeO}_{6}$…
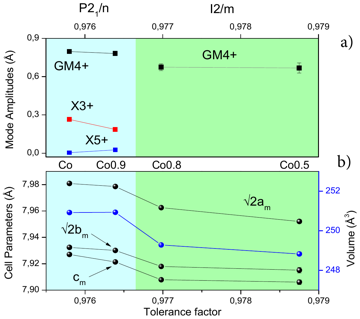 Figure 9.4 · amplitude-vs-t · Thesis 4 · Orayech 2015Variation, as function of the tolerance factor, of the three distortion irrep amplitudes $\mathrm{GM}_{4}^{+}$ (black), $\mathrm{X}_{3}^{+}$…
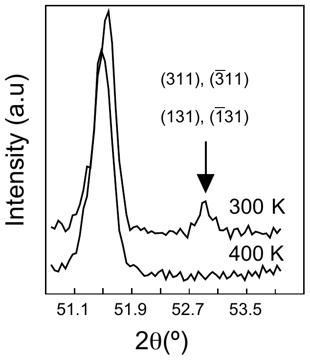 Figure 9.5 · pattern · Thesis 4 · Orayech 2015Disappearance, as temperature increases, of the primitive reflections (311), (-311), (131) and (-131) of the $\mathrm{Sr}_{2} \mathrm{Co}_{0.9} \mathrm{Mg}_{0.1} \mathrm{TeO}_{6}$…
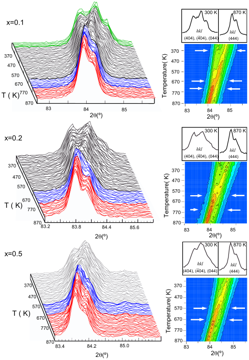 Figure 9.6 · pattern · Thesis 4 · Orayech 2015Thermal evolution of the (444) cubic reflection splitting located in the interval ( $82^{\circ}<2 \theta<{ }^{\circ} 86$) for the $\mathrm{Sr}_{2} \mathrm{Co}_{1-x} \mathrm{Mg}_{x} \mathrm{TeO}_{6}$…
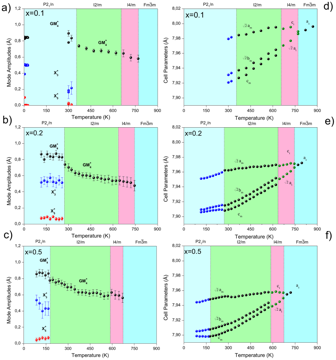 Figure 9.7 · amplitude-vs-t · Thesis 4 · Orayech 2015Temperature dependence of (a-c) the amplitudes of the modes related to the $P 2_{1} / n, I 2 / m$ and $I 4 / m$ symmetries and (d-f) their c…
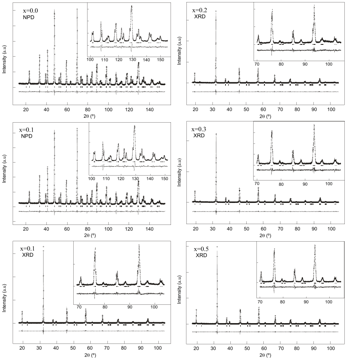 Figure 10.1 · rietveld-plot · Thesis 4 · Orayech 2015Experimental (symbols) and calculated (line) X-ray profiles and neutron profiles for the Rietveld refinement of the $\mathrm{Sr}_{2} \mathrm{Ni}_{1-x} \mathrm{Mg}_{x} \mathrm{TeO}_{6}$…
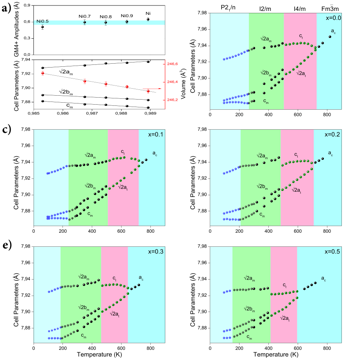 Figure 10.2 · amplitude-vs-t · Thesis 4 · Orayech 2015(a): Variation, as function of the tolerance factor, of the distortion-amplitude transforming according to the $\mathrm{GM}_{4}^{+}$irrep an…
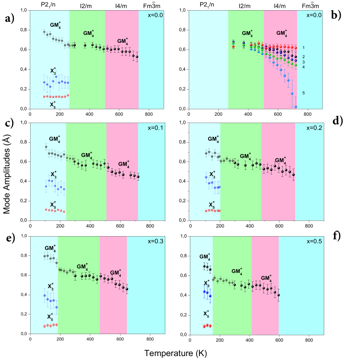 Figure 10.3 · amplitude-vs-t · Thesis 4 · Orayech 2015Temperature dependence of the mode-amplitudes refined in the $P 2_{1} / n, I 2 / m$ and $I 4 / m$ space groups for the $\mathrm{Sr}_{2} \mathrm{Ni}_{1-x} \mathrm{Mg}_{x} \mathrm{TeO}_{6}$…
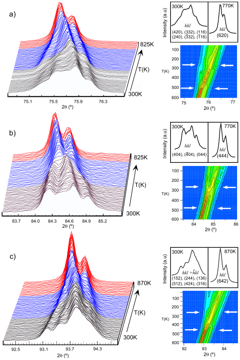 Figure 10.4 · pattern · Thesis 4 · Orayech 2015Thermal evolution of different splitted reflections for the $\mathrm{Sr}_{2} \mathrm{NiTeO}_{6}$ compound.
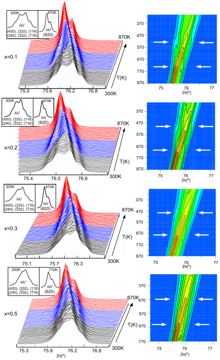 Figure 10.5 · pattern · Thesis 4 · Orayech 2015Thermal evolution of different splitted reflections located in the interval ( $75^{\circ}<2 \theta<^{\circ} 77$) for the $\mathrm{Sr}_{2} \mathrm{Co}_{1-x} \mathrm{Mg}_{x} \mathrm{TeO}_{6}$…
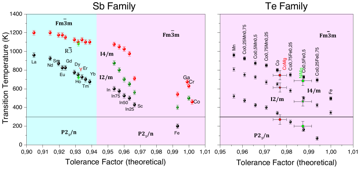 Figure 10.6 · phase-diagram · Thesis 4 · Orayech 2015Tolerance factor and temperature dependence phase diagram of $\mathrm{Sr}_{2} \mathrm{MSbO}_{6}$ and $\mathrm{Sr}_{2} \mathrm{MTeO}_{6}$. Th…
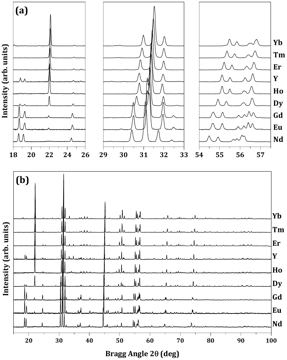 Figure 10.7 · pattern · Thesis 4 · Orayech 2015(a) Evolution of the laboratory X-ray powder diffraction patterns of $\mathrm{Ca}_{2} \mathrm{MSbO}_{6}(\mathrm{M}=\mathrm{Nd}, \mathrm{Eu}$…
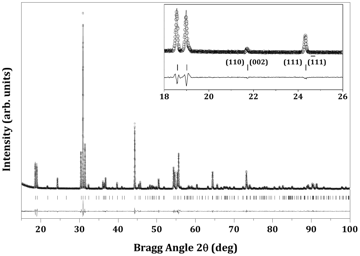 Figure 10.8 · rietveld-plot · Thesis 4 · Orayech 2015Experimental (symbols) and calculated (line) X-ray powder diffraction profiles for the Rietveld refinement of $\mathrm{Ca}_{2} \mathrm{EuSbO}_{6}$…
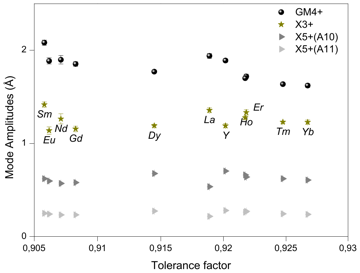 Figure 10.9 · amplitude-vs-t · Thesis 4 · Orayech 2015Variation of the $\mathrm{GM}_{4}^{+}, \mathrm{X}_{3}^{+}$and $\mathrm{X}_{5}^{+}$distortion irreps in the monoclinic symmetry $P 2_{1} / n$…
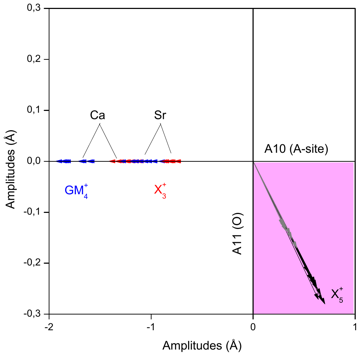 Figure 10.10 · amplitude-vs-t · Thesis 4 · Orayech 2015Two dimensional section showing the obtained amplitudes of the irreps (Blue) $\mathrm{GM}_{4}^{+}$, (Red) $\mathrm{X}_{3}^{+}$and the two co…
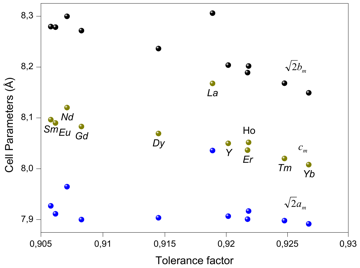 Figure 10.11 · cell-vs-t · Thesis 4 · Orayech 2015Evolution, as a function of the tolerance factor increasing of the unit-cell parameters (a), the unit-cell volume (b) and the monoclinic ang…
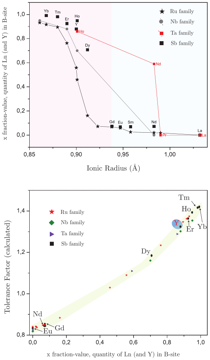 Figure 10.12 · other · Thesis 4 · Orayech 2015Evolution of the occupancy x (which is the fraction of the Calcium in the B-site occupying by the $\mathrm{M}^{3+}$ element in the formula $\left.\left[\mathrm{Ca}_{1+x} \mathrm{M}_{1-x}\right]\left[\mathrm{M}_{x} \mathrm{Ca}_{1-x}\right] \mathrm{SbO}_{6}\right)$…
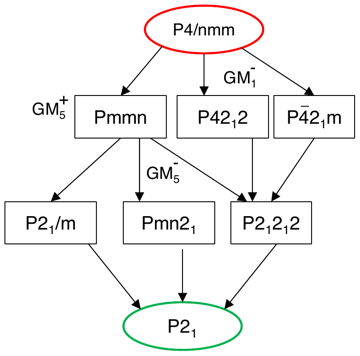 Figure 10.13 · group-subgroup-tree · Thesis 4 · Orayech 2015Group-subgroup tree connecting the paraelectric $P 4 / n m m$ phase to the ferroelectric $P 2_{1}$ phase
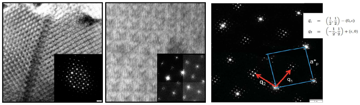 Figure 10.14 · structure-drawing · Thesis 4 · Orayech 2015Images in the real space and in the reciprocal space, showing clearly the Nano-Chessboard structure.
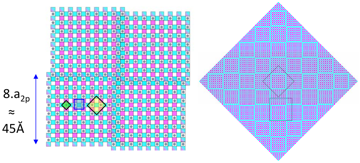 Figure 10.15 · structure-drawing · Thesis 4 · Orayech 2015Theoretical models describing the Nano-Chessboards structure.
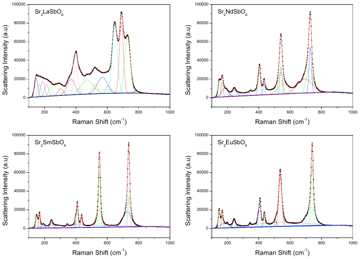 Figure 10.16 · raman · Thesis 4 · Orayech 2015Raman spectra of the monoclinic $\mathrm{Sr}_{2} \mathrm{MSbO}_{6}(\mathrm{M}=\mathrm{La}, \mathrm{Nd}, \mathrm{Sm}$ and Eu$)$ measured at r…
 Figure p62-842 · other · Thesis 4 · Orayech 2015(no caption found; uncaptioned image)
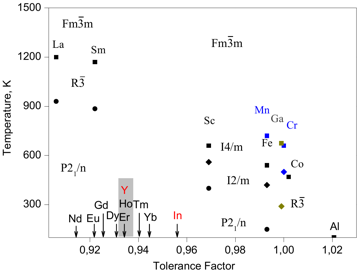 Figure p130-1662 · other · Thesis 4 · Orayech 2015(no caption found; uncaptioned image)
 Figure p218-2566 · other · Thesis 4 · Orayech 2015(no caption found; uncaptioned image)
 Figure p219-2573 · other · Thesis 4 · Orayech 2015(no caption found; uncaptioned image)
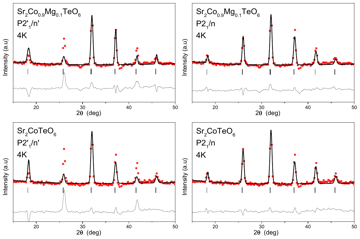 Figure p220-2580 · other · Thesis 4 · Orayech 2015(no caption found; uncaptioned image)
 Figure p221-2587 · other · Thesis 4 · Orayech 2015(no caption found; uncaptioned image)
 Figure p222-2615 · other · Thesis 4 · Orayech 2015(no caption found; uncaptioned image)
 Figure p224-2665 · other · Thesis 4 · Orayech 2015(no caption found; uncaptioned image)
 Figure p226-2703 · other · Thesis 4 · Orayech 2015(no caption found; uncaptioned image)
 Figure p254-3554 · other · Thesis 4 · Orayech 2015(no caption found; uncaptioned image)
 Figure p254-3557 · other · Thesis 4 · Orayech 2015(no caption found; uncaptioned image)
 Figure p255-3560 · other · Thesis 4 · Orayech 2015(no caption found; uncaptioned image)
 Figure p255-3563 · other · Thesis 4 · Orayech 2015(no caption found; uncaptioned image)
 Figure p256-3578 · other · Thesis 4 · Orayech 2015(no caption found; uncaptioned image)
 Figure p257-3592 · other · Thesis 4 · Orayech 2015(no caption found; uncaptioned image)
 Figure p258-3609 · other · Thesis 4 · Orayech 2015(no caption found; uncaptioned image)
 Figure p259-3625 · other · Thesis 4 · Orayech 2015(no caption found; uncaptioned image)
 Figure p260-3643 · other · Thesis 4 · Orayech 2015(no caption found; uncaptioned image)
 Figure p261-3674 · other · Thesis 4 · Orayech 2015(no caption found; uncaptioned image)
 Figure p262-3703 · other · Thesis 4 · Orayech 2015(no caption found; uncaptioned image)
 Figure p263-3724 · other · Thesis 4 · Orayech 2015(no caption found; uncaptioned image)
 Figure p264-3729 · other · Thesis 4 · Orayech 2015(no caption found; uncaptioned image)
 Figure p264-3734 · other · Thesis 4 · Orayech 2015(no caption found; uncaptioned image)