Figure 10.3 · Thesis 3 · Iturbe 2012
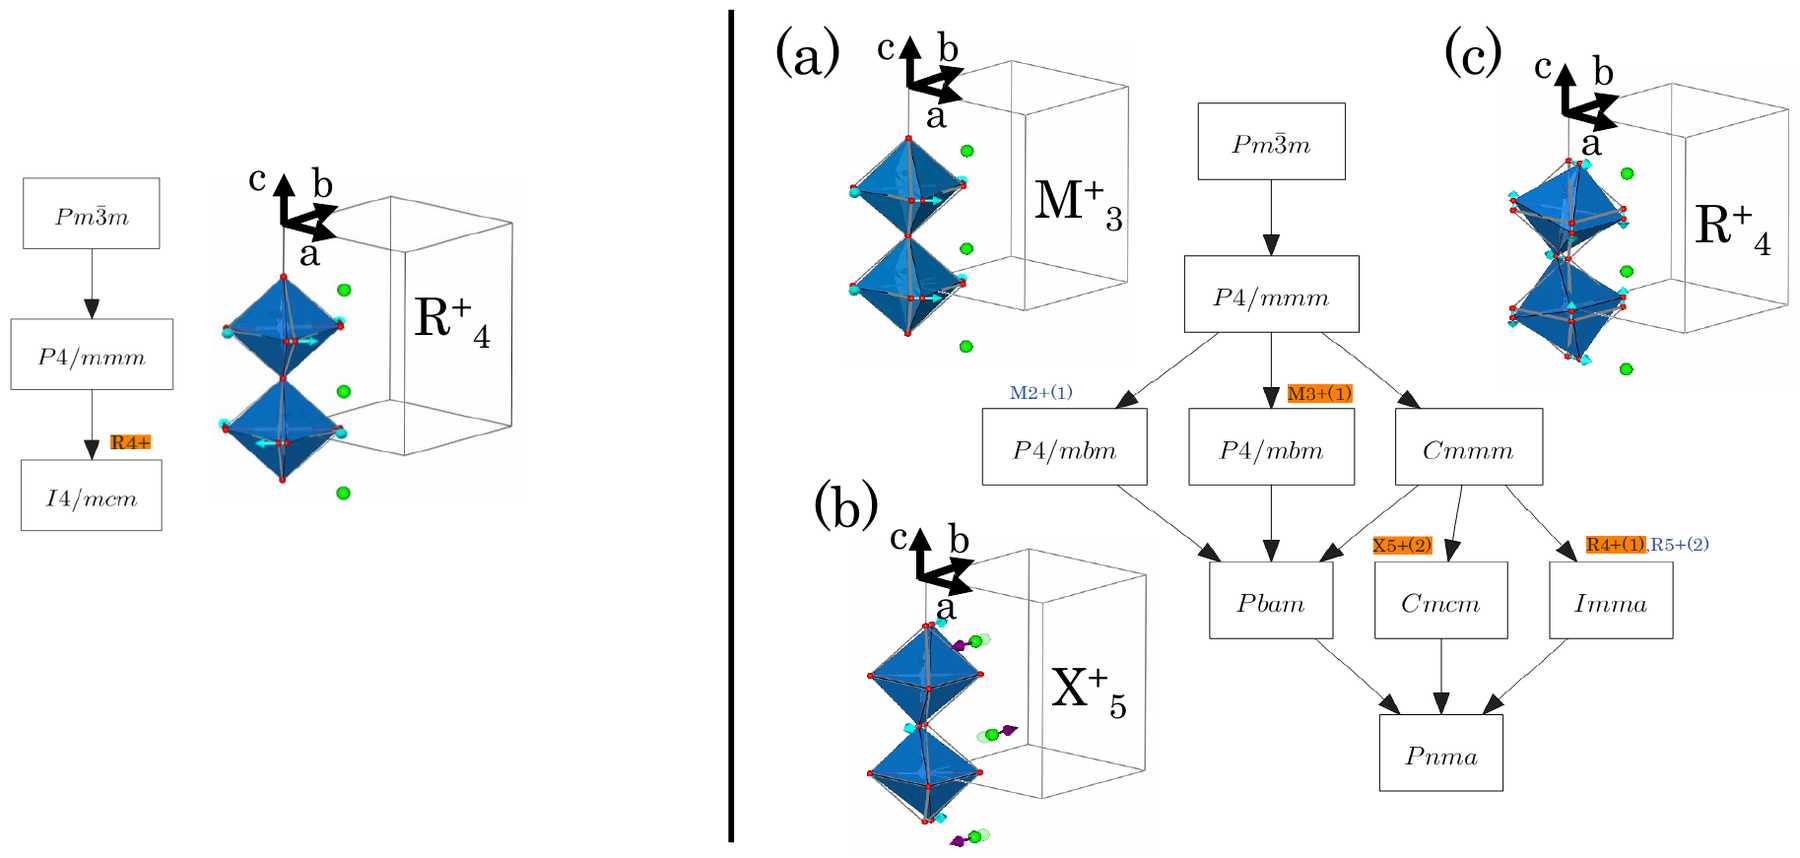
Graph of maximal subgroups connecting the space group P m \overline{3} m and its subgroups (left) I4/mcm (ITA No.140) and (right) Pbnm (ITA No. 62) via the (a-b,a+b,2c;0,0,0) and (a+b,a-b,-2c;1/2,1/2,0) transformation matrix, respectively. The active distortion modes are highlighted in orange. Green, blue, and red spheres indicate A / L n, \mathrm{Cu} / \mathrm{Ti}, and O atoms, respectively and the archetype phase structure in Pbnm bases is shown with grey octahedra (red sphere as oxygens), and light green spheres indicating A / \operatorname{Ln} atoms.
- Document
- Thesis 3 · Iturbe 2012
- Figure
- 10.3
- Kind
- group-subgroup-tree
- Rights
- own
- Reproduce
- not-needed
auto-cropped from the OCR Markdown crop box (stage B); materials and kind to be reviewed in Phase 1
Evidence
- doc:thesis-03 · figure 10.3 · page 180 · OCR line 2161 · thesis-only · crop re-fitted to the ink extent crop re-fitted to the ink extent