Figure 9 · Thesis 2 · Faik 2009
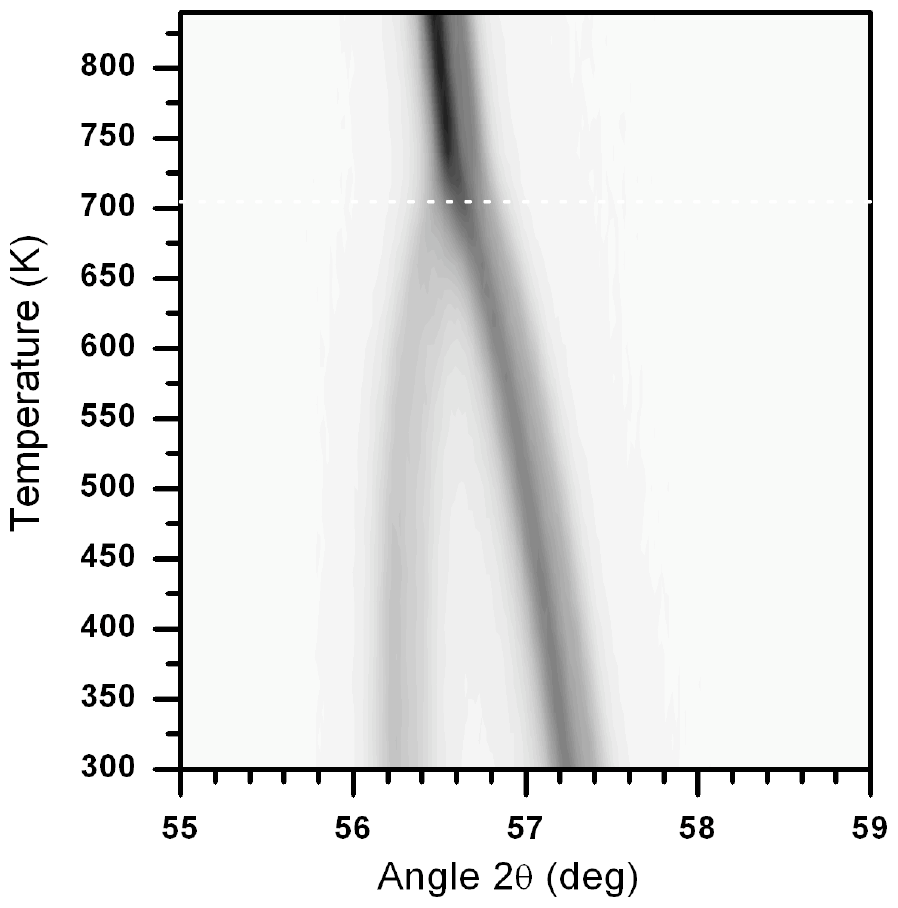
shows the phase transition temperatures as a function of the tolerance factor t. From this figure, we conclude that the phase transition temperatures increase with decreasing of the value of
- Document
- Thesis 2 · Faik 2009
- Figure
- 9
- Kind
- other
- Rights
- own
- Reproduce
- not-needed
auto-cropped from the OCR Markdown crop box (stage B); materials and kind to be reviewed in Phase 1
Evidence
- doc:thesis-02 · figure 9 · page 210 · OCR line 2356 · thesis-only · crop box: OCR box scaled to the 300 dpi page and fitted to the ink extent