Figure 5.2 · Thesis 4 · Orayech 2015
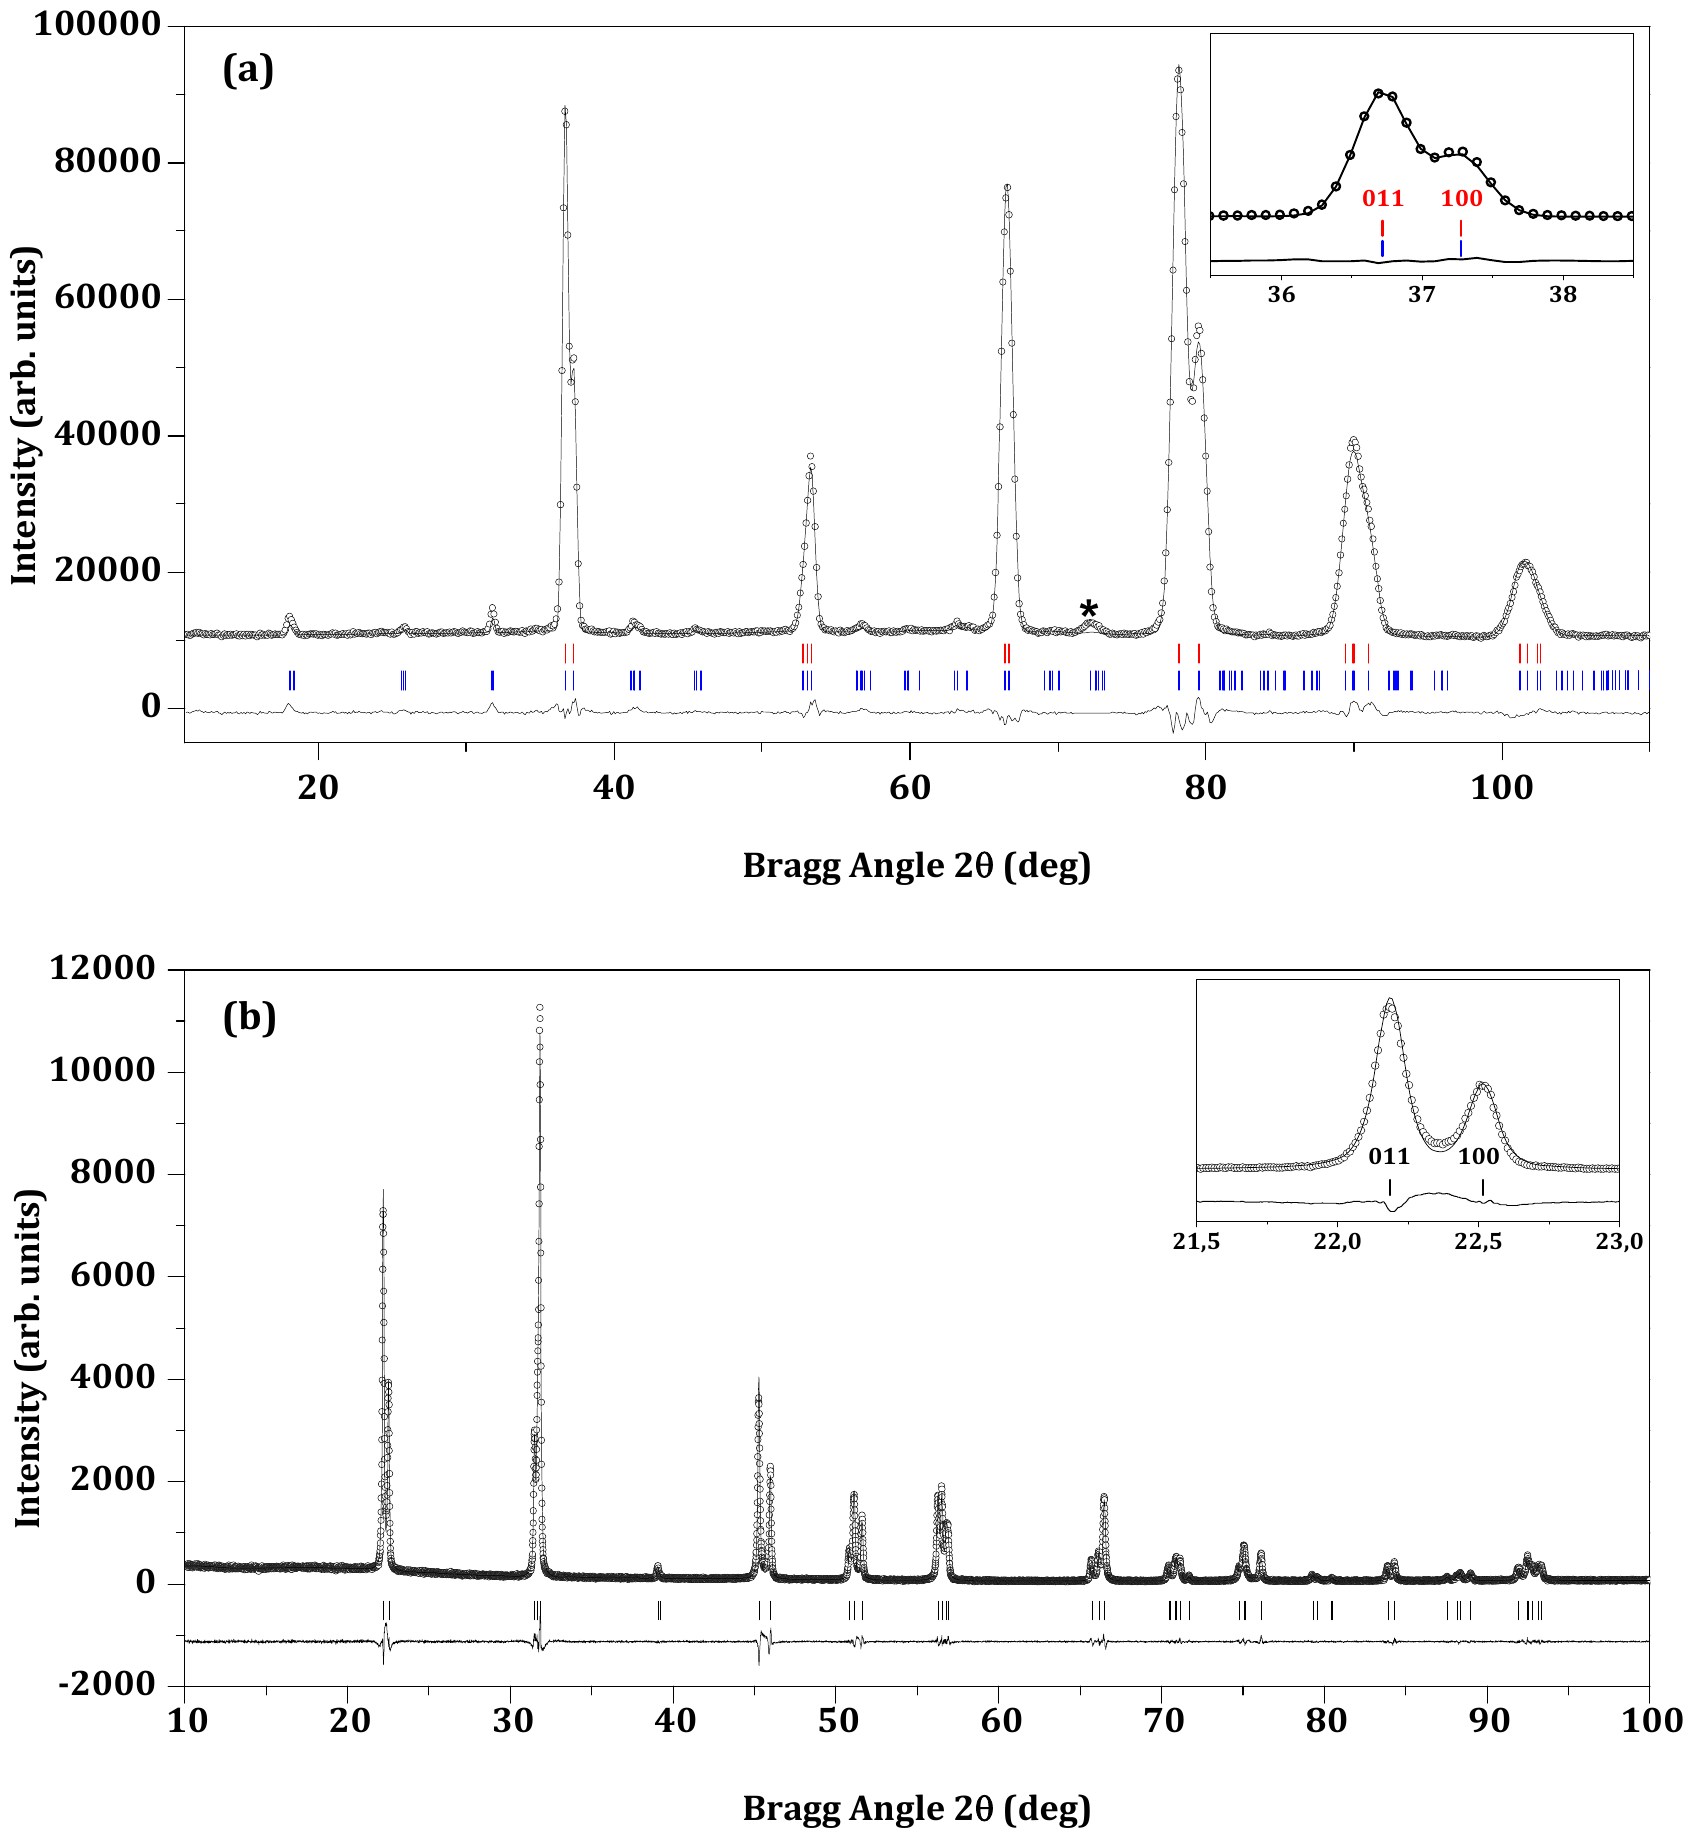
**Experimental (symbols) and calculated (line) a) neutron and b) X-ray profiles for the Rietveld refinement of \mathrm{Na}_{0.5} \mathrm{K}_{0.5} \mathrm{NbO}_{3} at room-temperature using a structural model with Amm2 space group. Insets show in detail the presence of the 011 and 100 Bragg reflections corresponding to the orthorhombic symmetry. The (*)-symbol marked reflection corresponds to the signal of the Vanadium sample container used during the measurement. The bars in the lower part of the graphics represent the Bragg peak positions. In (a), the upper set of bars (in red) correspond to the first wavelength \lambda_{1}=2.52 \AA, and the lower set of bars (in blue) correspond to the second wavelength and \lambda_{2}=1.26 \AA.**
- Document
- Thesis 4 · Orayech 2015
- Figure
- 5.2
- Kind
- rietveld-plot
- Rights
- own
- Reproduce
- not-needed
auto-cropped from the OCR Markdown crop box (stage B); materials and kind to be reviewed in Phase 1
Evidence
- doc:thesis-04 · figure 5.2 · page 77 · OCR line 1058 · thesis-only · crop box: OCR box scaled to the 300 dpi page and fitted to the ink extent