Figure 5.9 · Thesis 4 · Orayech 2015
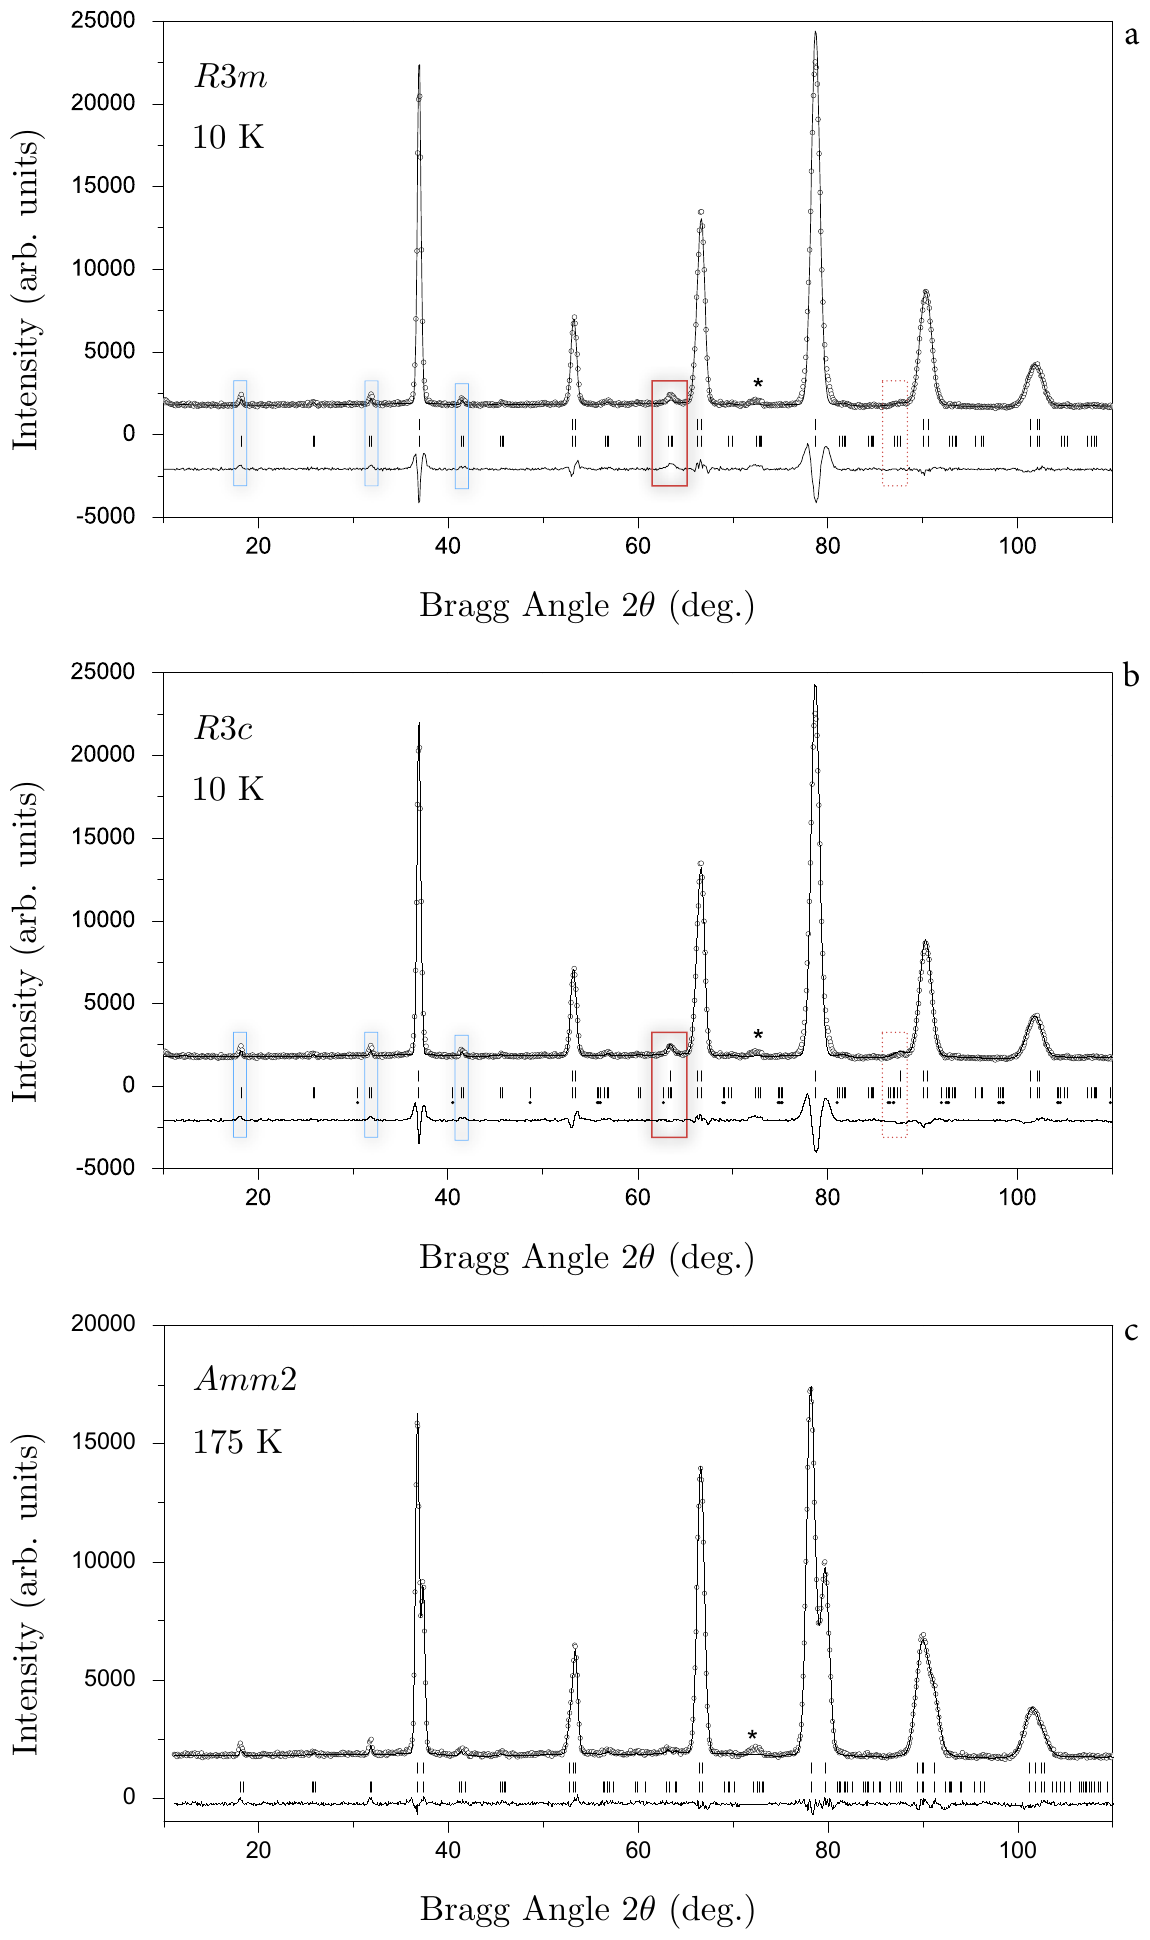
Experimental (symbols) and calculated (line) neutron profiles for the Rietveld refinement of \mathrm{Na}_{0.5} \mathrm{K}_{0.5} \mathrm{NbO}_{3} (a) and (b) at 10 K and (c) 175 K, using a structural model with (a) R 3 m, (b) R 3 c and (c) A m m 2 space groups. The double set of vertical bars in (a) and (b) indicates the Bragg reflections from the main wavelength ( 2.52 \AA) (upper) and from the leak ( 1.26 \AA=\frac{1}{2} 2.52) (lower). The blue and red boxes show the Bragg reflections assigned, incorrectly, to the wavelength leak, if the R 3 m space group model is used. The dots in the low vertical bars, (b), are the distinct Bragg reflections due to the wavelength leak in the R 3 c and R 3 m models.
- Document
- Thesis 4 · Orayech 2015
- Figure
- 5.9
- Kind
- rietveld-plot
- Rights
- own
- Reproduce
- not-needed
auto-cropped from the OCR Markdown crop box (stage B); materials and kind to be reviewed in Phase 1
Evidence
- doc:thesis-04 · figure 5.9 · page 87 · OCR line 1195 · thesis-only · crop box: OCR box scaled to the 300 dpi page and fitted to the ink extent