Figure 5.14 · Thesis 4 · Orayech 2015
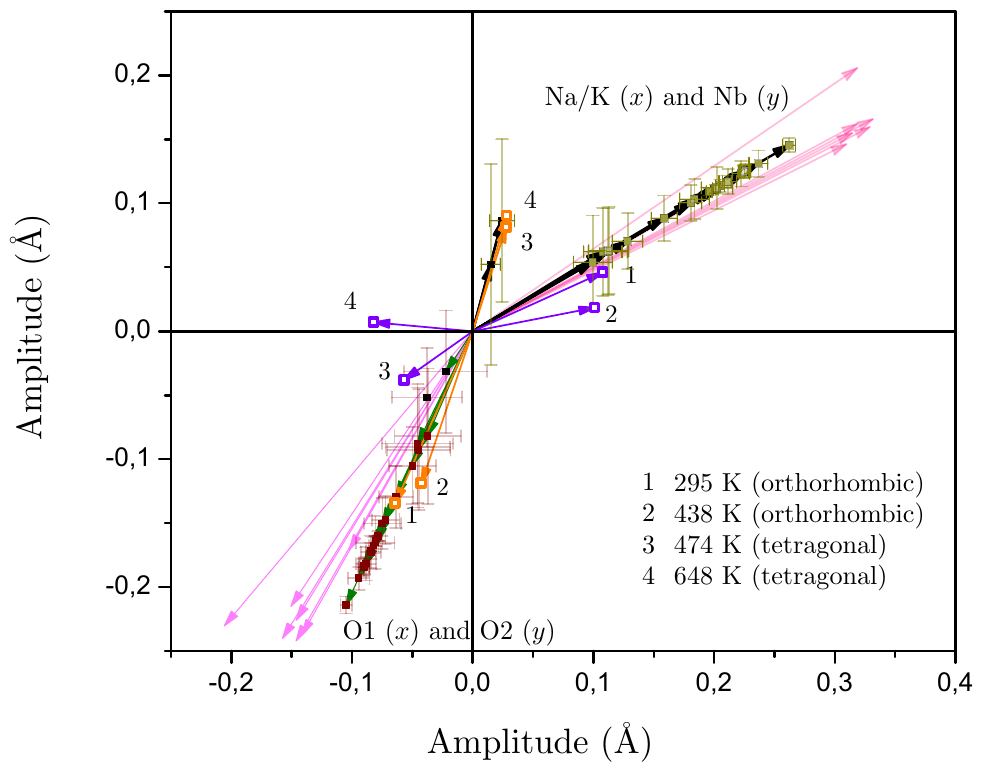
Evolution with temperature of the tetra-vector, but split in two parts: amplitudes of the modes \mathrm{Na} / \mathrm{K}(x) versus those of \mathrm{Nb}(\mathrm{y}); amplitude values of the modes acting on the O atoms, \mathrm{O} 1(x) versus O 2 (y). We are plotting two two-dimensional vectors in the x y plane: as black arrows, the evolution in all the distorted phases of the couple of amplitudes; at the vertices of the arrows, in green, the corresponding errors. The four points (1-4), represent values for the amplitudes obtained at the indicated temperatures, taken from \frac{97}{97} passed to AMPLIMODES. Data from single crystal XRD. We have also plot some results from \frac{[6]}{} pertaining to structures of related compounds, all in the tetragonal phase. The matching of the internal direction is very good.
- Document
- Thesis 4 · Orayech 2015
- Figure
- 5.14
- Kind
- amplitude-vs-t
- Rights
- own
- Reproduce
- not-needed
auto-cropped from the OCR Markdown crop box (stage B); materials and kind to be reviewed in Phase 1
Evidence
- doc:thesis-04 · figure 5.14 · page 95 · OCR line 1286 · thesis-only · crop box: OCR box scaled to the 300 dpi page and fitted to the ink extent