Figure 7.8 · Thesis 3 · Iturbe 2012
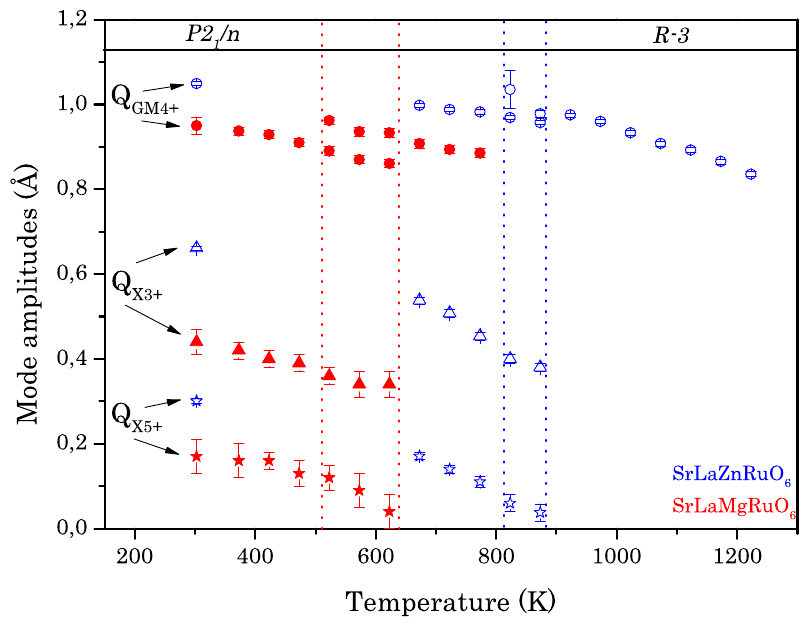
Temperature evolution of the \mathrm{GM}_{4}^{+}, \mathrm{X}_{3}^{+}and \mathrm{X}_{5}^{+}mode amplitudes, as obtained from refinement of the NPD data for \mathrm{SrLaZnRuO}_{6} (blue, opened symbols) and \mathrm{SrLaMgRuO}_{6} (red, closed symbols). Dashed lines indicate the temperature range of coexistence between the P 2_{1} / n and R \overline{3} phases.
- Document
- Thesis 3 · Iturbe 2012
- Figure
- 7.8
- Kind
- amplitude-vs-t
- Rights
- own
- Reproduce
- not-needed
auto-cropped from the OCR Markdown crop box (stage B); materials and kind to be reviewed in Phase 1
Evidence
- doc:thesis-03 · figure 7.8 · page 142 · OCR line 1679 · thesis-only · crop box: OCR box scaled to the 300 dpi page and fitted to the ink extent