Figure 9.9 · Thesis 3 · Iturbe 2012
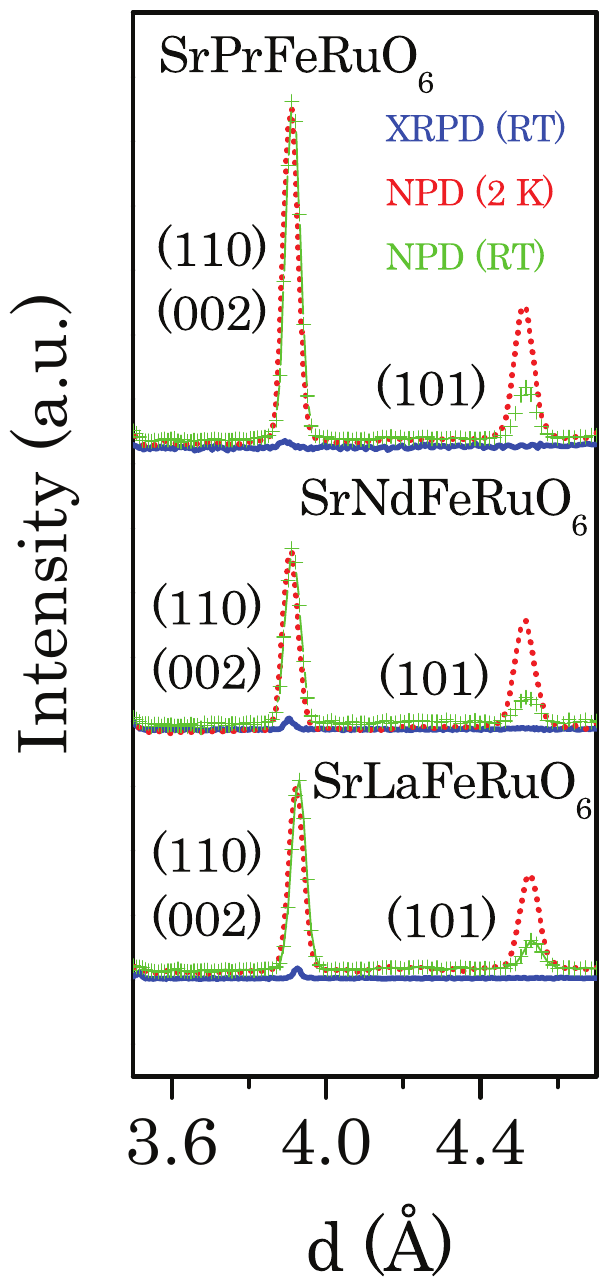
XRPD data at RT (blue line), NPD data at 2 K (red dotted line) and RT (green crossed line) in d space (in Å). All patterns are re-normalized with respect to the peak height of the main (112/200) index peak at 2 \theta \sim 32.6^{\circ}(d \sim 2.7 \AA).
- Document
- Thesis 3 · Iturbe 2012
- Figure
- 9.9
- Kind
- pattern
- Rights
- own
- Reproduce
- not-needed
auto-cropped from the OCR Markdown crop box (stage B); materials and kind to be reviewed in Phase 1
Evidence
- doc:thesis-03 · figure 9.9 · page 167 · OCR line 1962 · thesis-only · crop box: OCR box scaled to the 300 dpi page and fitted to the ink extent