Figure 5.13 · Thesis 3 · Iturbe 2012
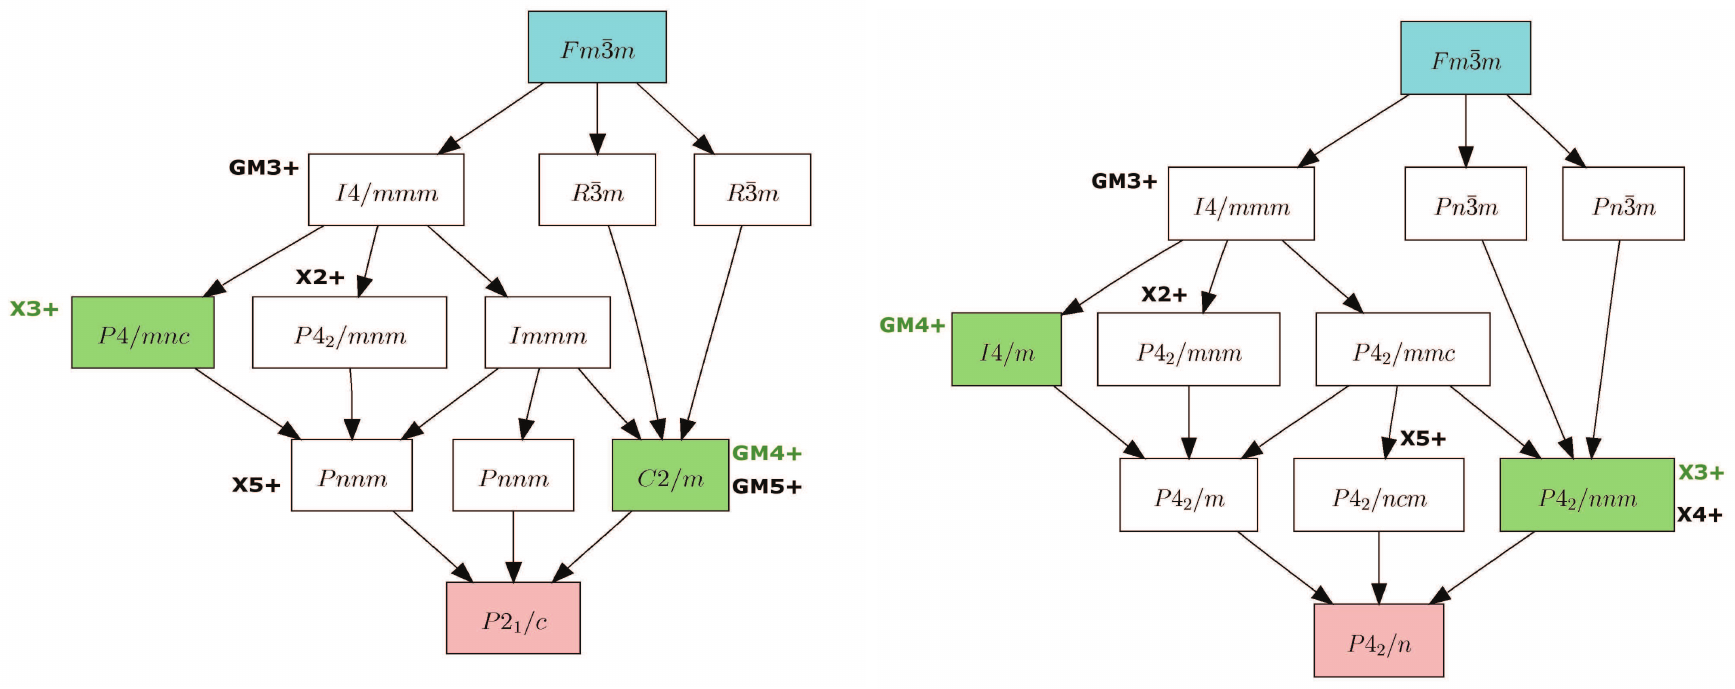
Graph of maximal subgroups relating the space groups of the parent (highlighted in blue) and distorted P 2_{1} / n and P 4_{2} / n phase (highlighted in red) of \mathrm{SrNdMRuO}_{6} compounds. For each subgroup any irrep yielding this symmetry is indicated and the two primary active irreps evidenced by the Rietveld refinement are highlighted in green. In the scheme we are using the standard settings of the space groups as the BCS does for generating these graphs. P 2_{1} / c is the standard setting of P 2_{1} / n.
- Document
- Thesis 3 · Iturbe 2012
- Figure
- 5.13
- Kind
- rietveld-plot
- Rights
- own
- Reproduce
- not-needed
auto-cropped from the OCR Markdown crop box (stage B); materials and kind to be reviewed in Phase 1
Evidence
- doc:thesis-03 · figure 5.13 · page 100 · OCR line 1124 · thesis-only · crop box: OCR box scaled to the 300 dpi page and fitted to the ink extent