Figure 4.1 · Thesis 3 · Iturbe 2012
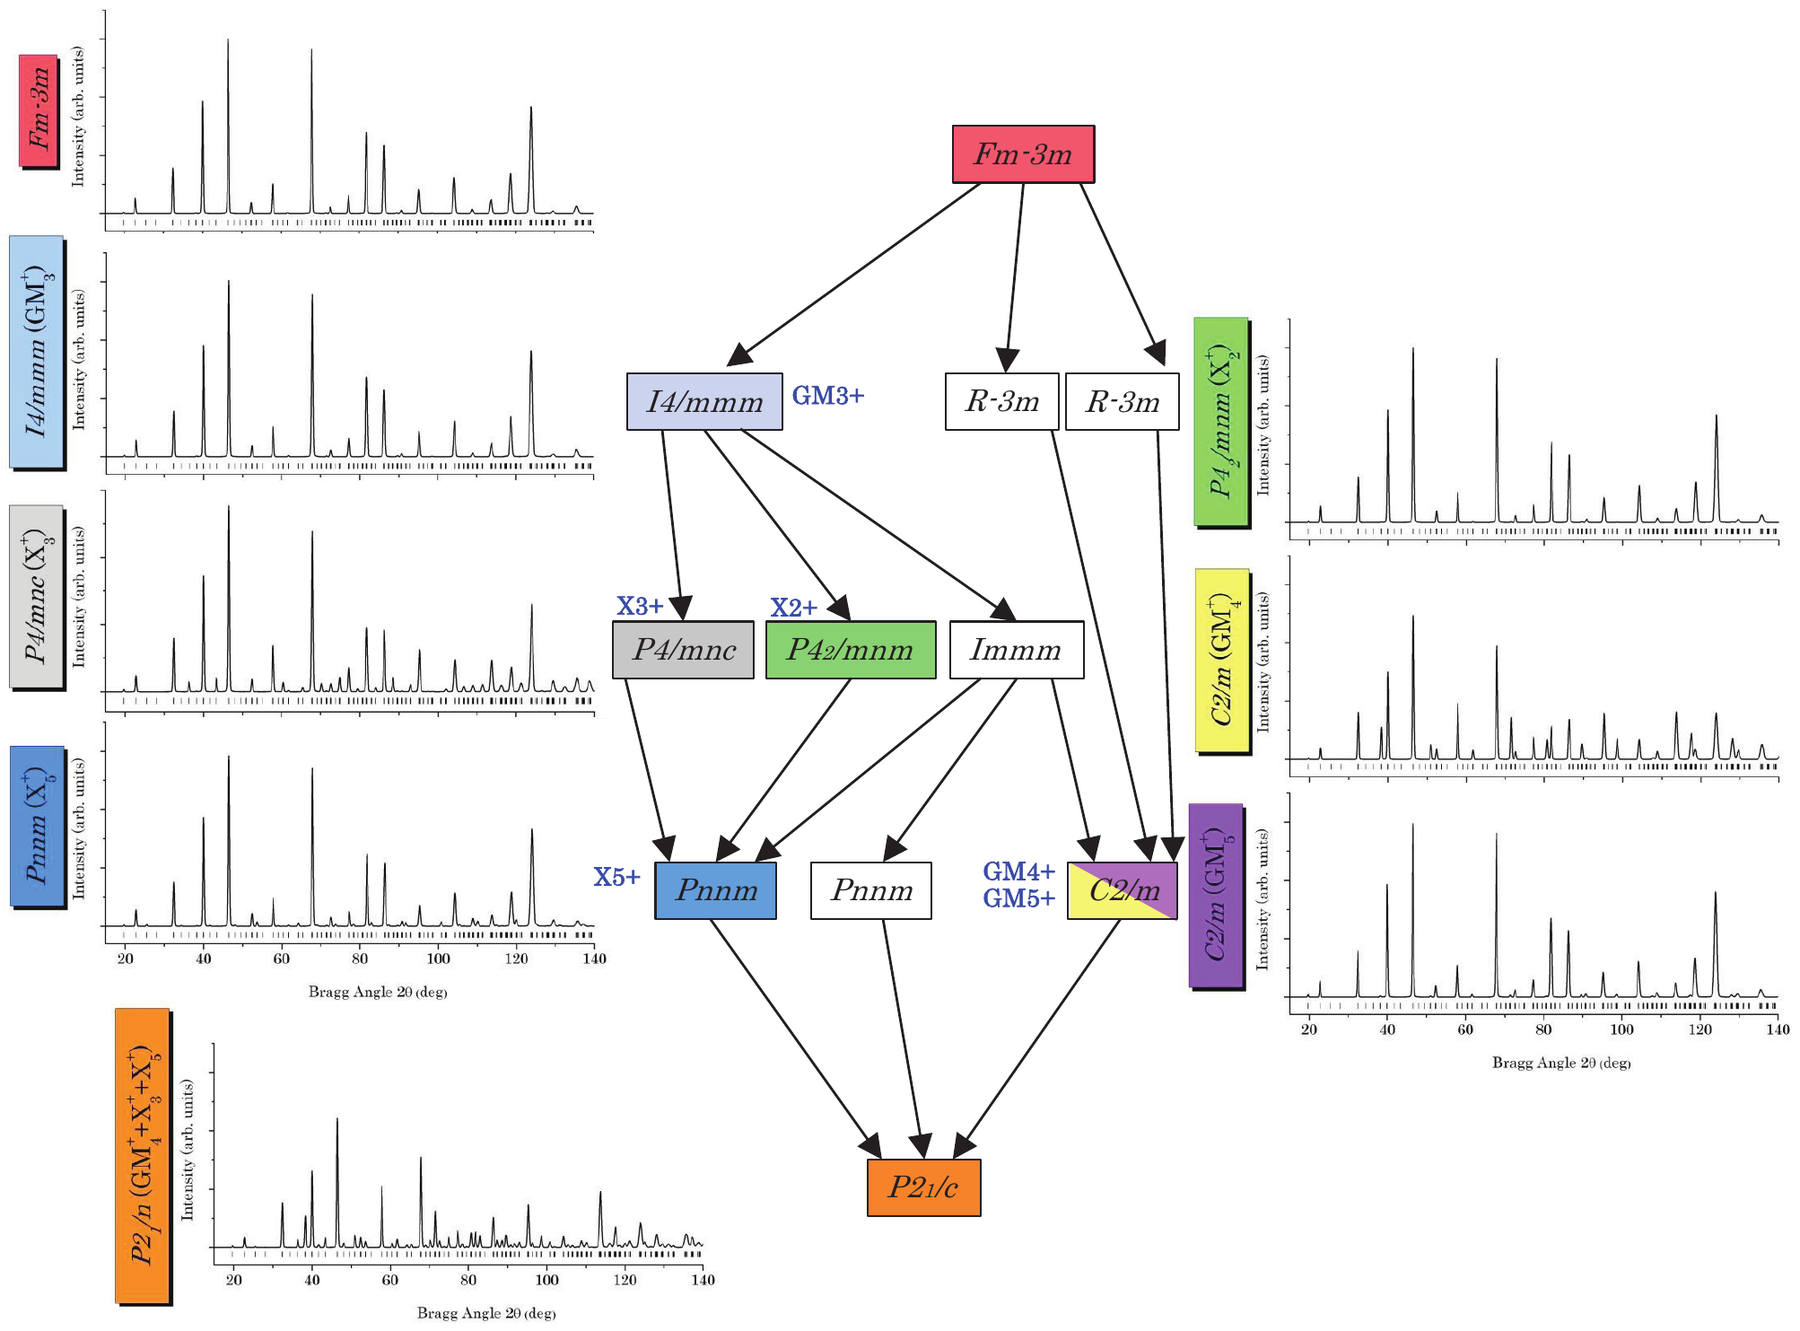
Graph of maximal subgroups relating the F m \overline{3} m and the P 2_{1} / c space groups of room temperature \operatorname{Sr} L n M R u \mathrm{O}_{6}(L n=\mathrm{La}, \mathrm{Nd}, \mathrm{Pr}; M=\mathrm{Zn}, \mathrm{Co}, \mathrm{Mg}, \mathrm{Ni}) phases. For each space group, the irreducible representation of the distortion mode yielding this symmetry is indicated if existing. For the parent phase (red) and isotropy groups, the corresponding simulated patterns are plotted in the P 2_{1} / n non conventional monoclinic bases. The combination of distortion modes responsible for the F m \overline{3} m \rightarrow P 2_{1} / n symmetry-breaking are plotted for P 2_{1} / n (orange).
- Document
- Thesis 3 · Iturbe 2012
- Figure
- 4.1
- Kind
- group-subgroup-tree
- Rights
- own
- Reproduce
- not-needed
auto-cropped from the OCR Markdown crop box (stage B); materials and kind to be reviewed in Phase 1
Evidence
- doc:thesis-03 · figure 4.1 · page 73 · OCR line 885 · thesis-only · crop re-fitted to the ink extent crop re-fitted to the ink extent