Figure 9.3 · Thesis 4 · Orayech 2015
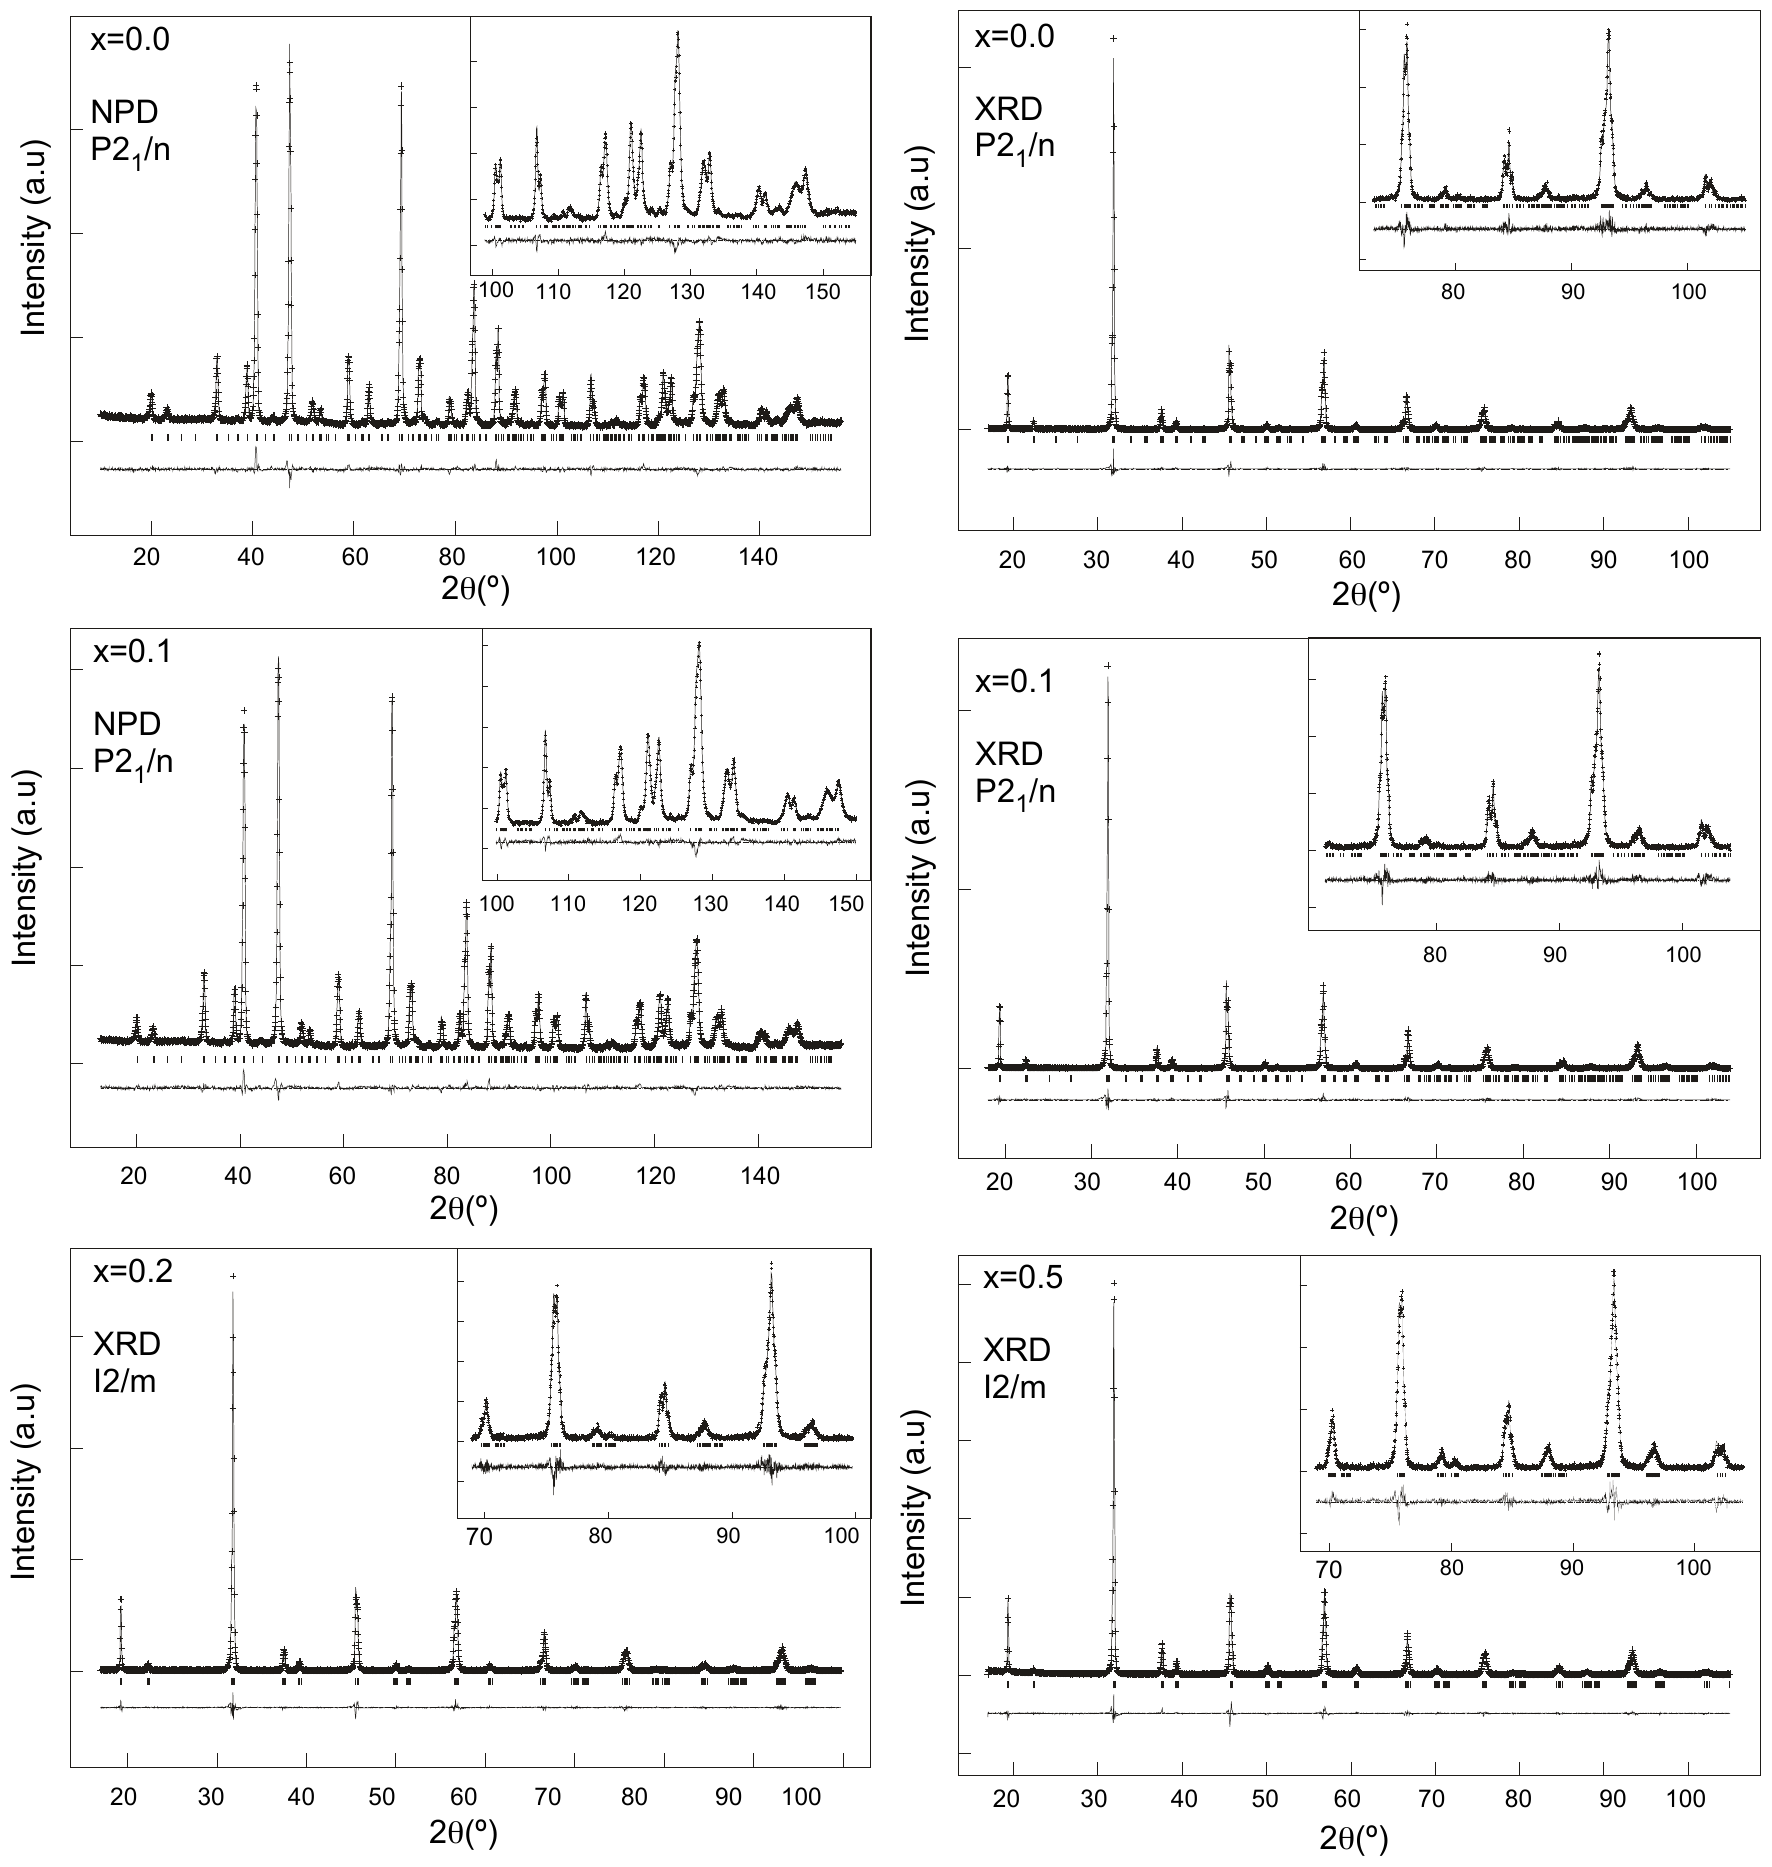
Experimental (symbols) and calculated (line) X-ray profiles and neutron profiles for the Rietveld refinement of the \mathrm{Sr}_{2} \mathrm{Co}_{1-x} \mathrm{Mg}_{x} \mathrm{TeO}_{6} series at room temperature using a structural model with P 2_{1} / n space group for ( \mathrm{x}=0.0 and 0.1) and I 2 / m for ( \mathrm{x}=0.2 and 0.5). The bars in the lower part of the graphics represent the Bragg peak positions.
- Document
- Thesis 4 · Orayech 2015
- Figure
- 9.3
- Kind
- rietveld-plot
- Rights
- own
- Reproduce
- not-needed
auto-cropped from the OCR Markdown crop box (stage B); materials and kind to be reviewed in Phase 1
Evidence
- doc:thesis-04 · figure 9.3 · page 165 · OCR line 2093 · thesis-only · crop box: OCR box scaled to the 300 dpi page and fitted to the ink extent