Figure 7.3 · Thesis 3 · Iturbe 2012
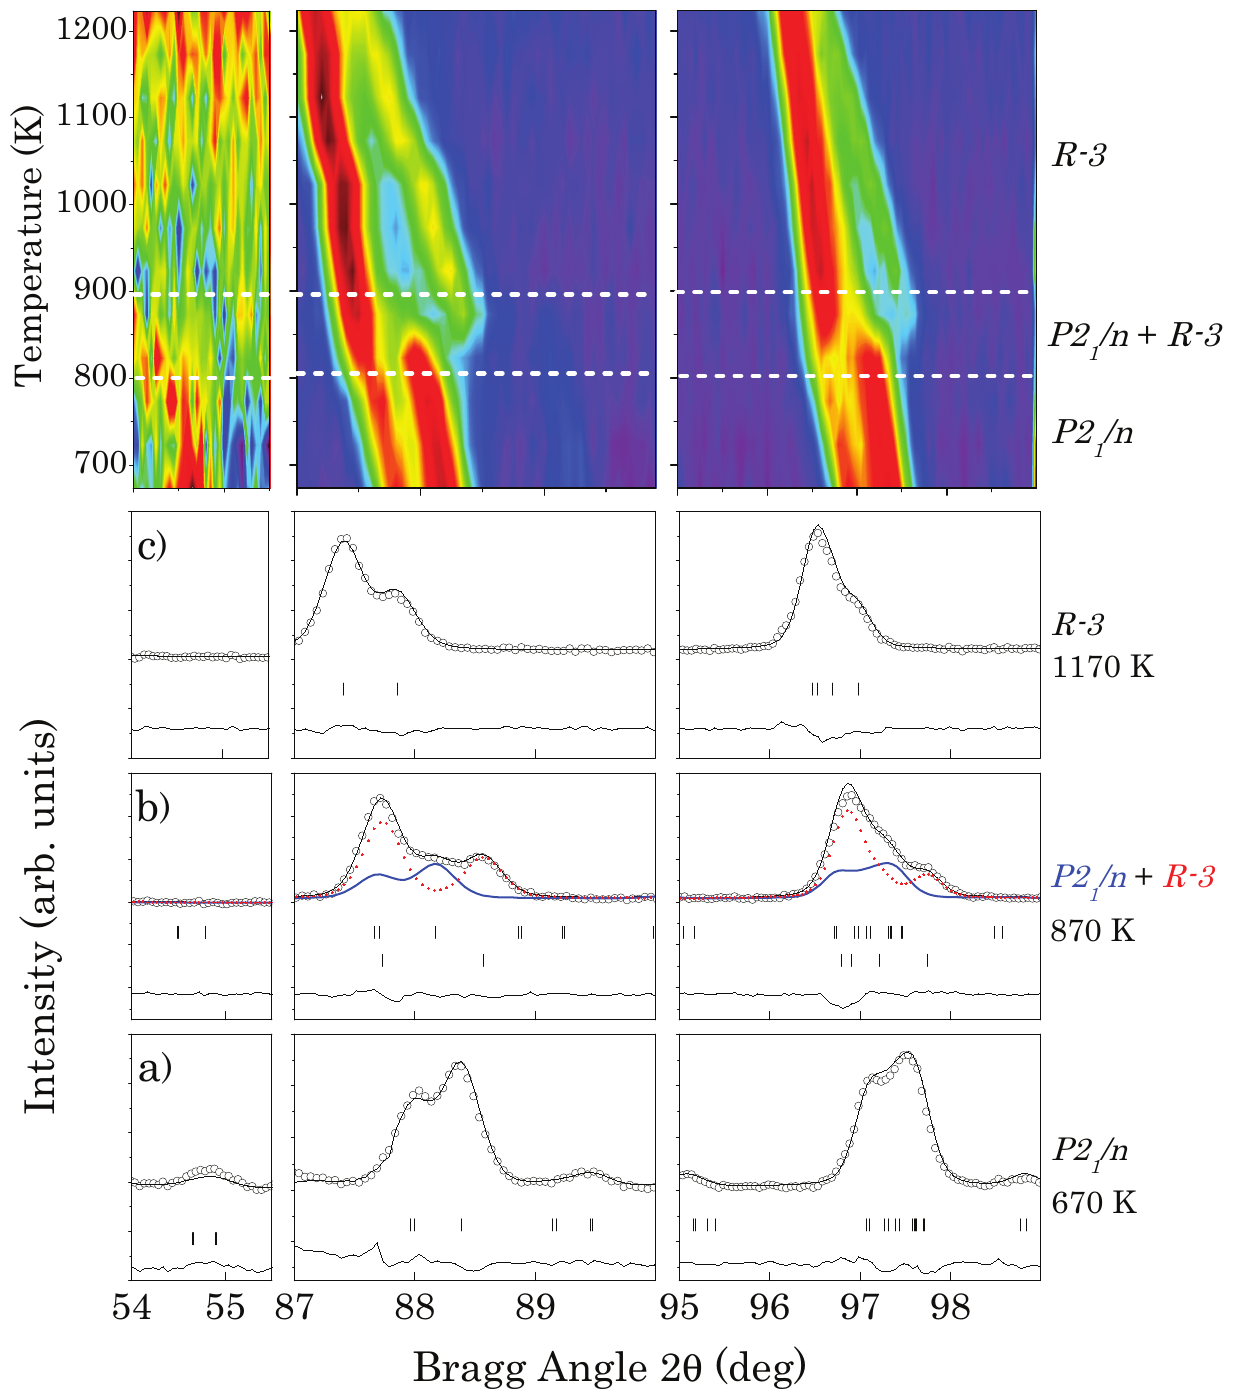
Temperature evolution of 54-55.5^{\circ} (primitive peak, (-311;311;-131;131)), 87.8-90 { }^{\circ} (cubic (444) reflection) and 95-99^{\circ} (cubic (642) reflection) 2 \theta ranges for \mathrm{SrLaZnRuO}_{6}. The calculated and the difference of the diffraction profiles are obtained after NPD data Rietveld refinement of the structure at each temperature. The structural models used in the refinements have the following symmetries: (a) P 2_{1} / n for 670 K, (b) coexistence of P 2_{1} / n and R \overline{3} phases for 870 K, and R \overline{3} for (c) 1170 K. Markers indicate Bragg reflections. In (b) blue continued line corresponds to P 2_{1} / n phase and red dotted line to R \overline{3} phase.
- Document
- Thesis 3 · Iturbe 2012
- Figure
- 7.3
- Kind
- rietveld-plot
- Rights
- own
- Reproduce
- not-needed
auto-cropped from the OCR Markdown crop box (stage B); materials and kind to be reviewed in Phase 1
Evidence
- doc:thesis-03 · figure 7.3 · page 137 · OCR line 1623 · thesis-only · crop box: OCR box scaled to the 300 dpi page and fitted to the ink extent