Figure 6.7 · Thesis 4 · Orayech 2015
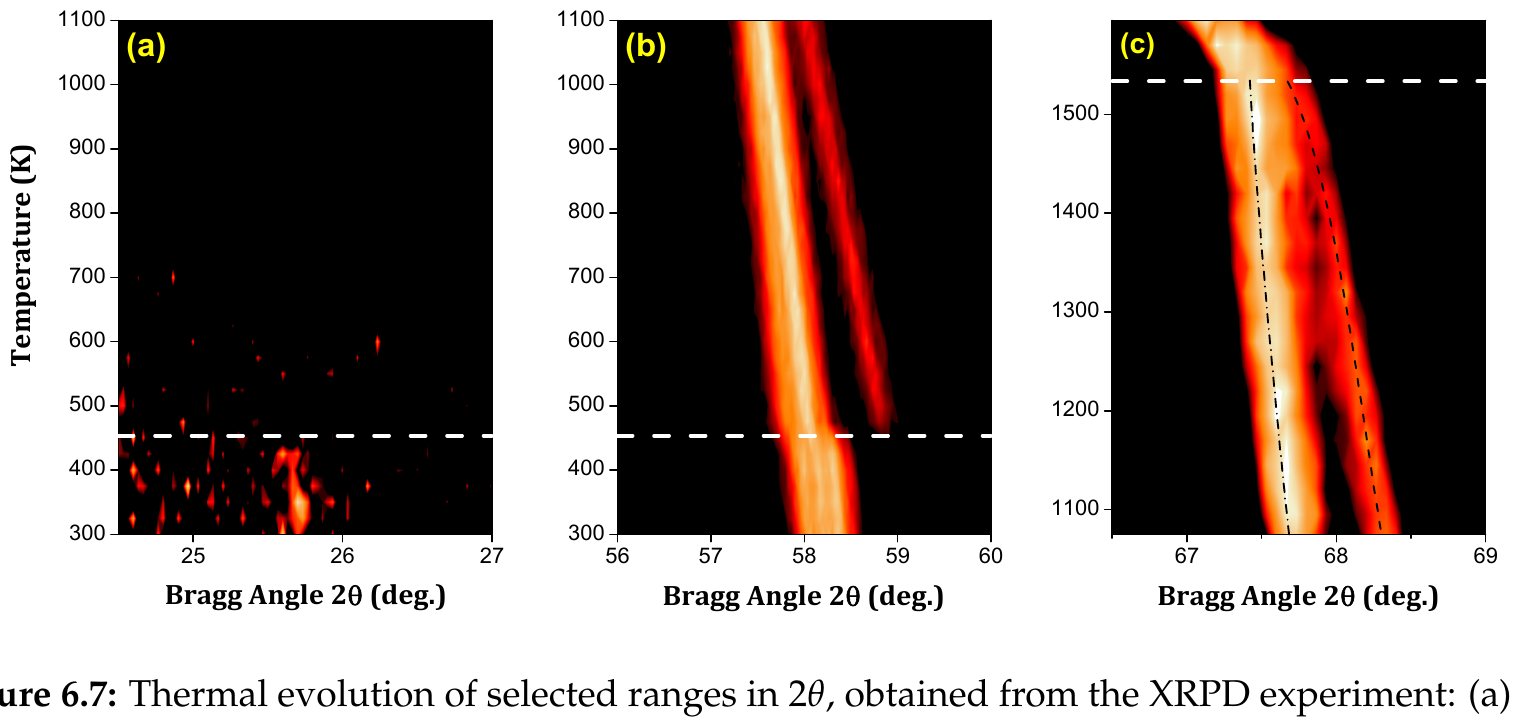
Thermal evolution of selected ranges in 2 \theta, obtained from the XRPD experiment: (a) 24.5-27^{\circ}, corresponding to the (111) primitive peak and (b) 56.5-60^{\circ} presenting a clear region to follow the evolving of the intensity. (c) Represents the 66.5-69^{\circ} 2 \theta interval corresponding to the (440) cubic reflections. In all the figures, the horizontal lines in blue, a guide to the eye, show the transition temperatures. The other dashed lines, in black, are a guide to follow the disappearance of the splittings.
- Document
- Thesis 4 · Orayech 2015
- Figure
- 6.7
- Kind
- pattern
- Rights
- own
- Reproduce
- not-needed
auto-cropped from the OCR Markdown crop box (stage B); materials and kind to be reviewed in Phase 1
Evidence
- doc:thesis-04 · figure 6.7 · page 117 · OCR line 1521 · thesis-only · crop box: OCR box scaled to the 300 dpi page and fitted to the ink extent