Figure 5.15 · Thesis 4 · Orayech 2015
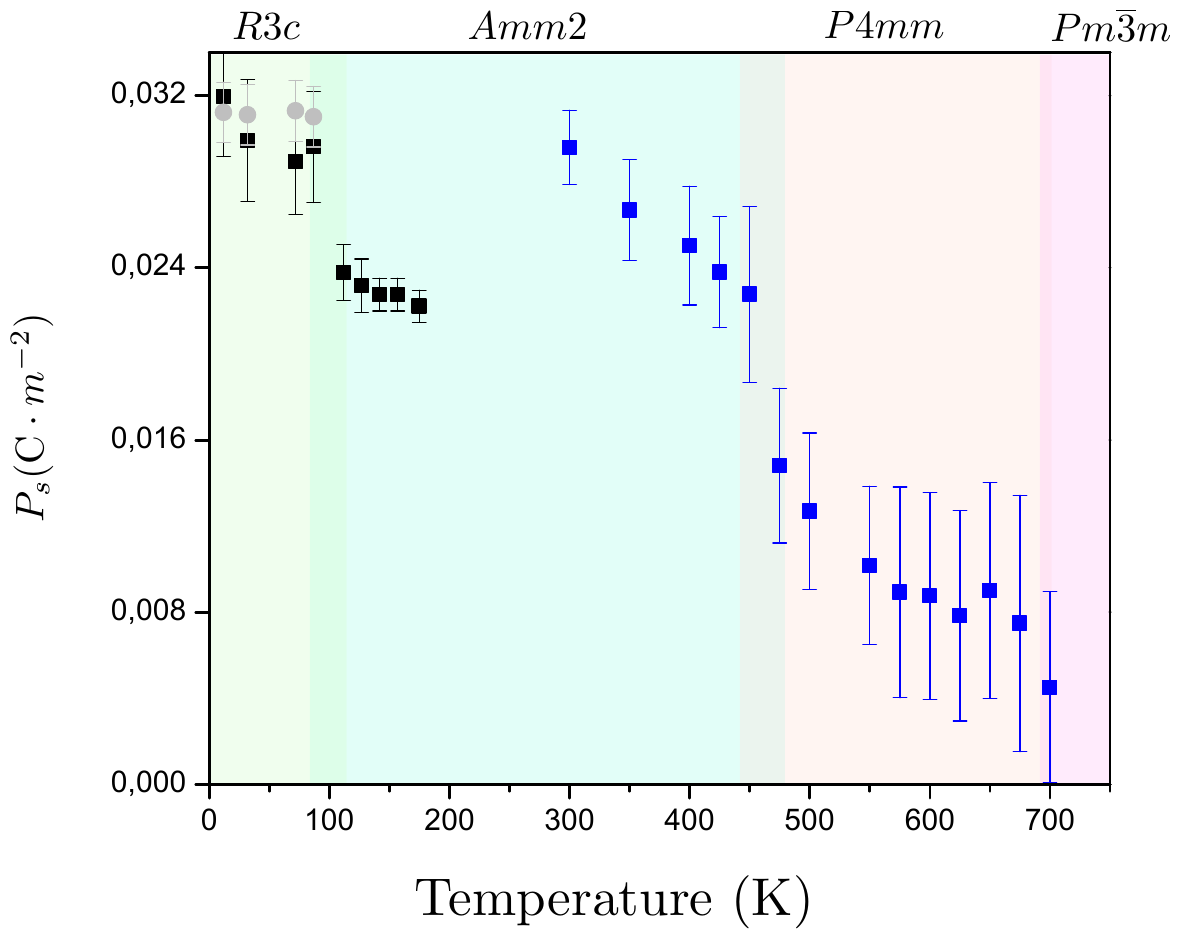
Calculated SP (see the text for further details). Different colours represent the points of the SP resulting from the data of different sources, i.e. NPD (black) and XRPD (blue). Dimmed symbols show the polarization values obtained in the R 3 m model, without the octahedral tilt.
- Document
- Thesis 4 · Orayech 2015
- Figure
- 5.15
- Kind
- structure-drawing
- Rights
- own
- Reproduce
- not-needed
auto-cropped from the OCR Markdown crop box (stage B); materials and kind to be reviewed in Phase 1
Evidence
- doc:thesis-04 · figure 5.15 · page 97 · OCR line 1299 · thesis-only · crop box: OCR box scaled to the 300 dpi page and fitted to the ink extent