Plates · cell-vs-t
Cell parameters and cell volume versus temperature; where phase transitions are read. 29 plates.
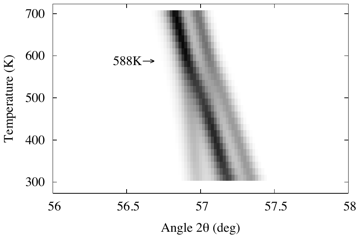 Figure 3.5 · cell-vs-t · Thesis 1 · Gateshki 2003Evolución con la temperatura de la reflexión cúbica (422) de $\mathrm{Sr}_{2} \mathrm{NiWO}_{6}$. La transición de fase continua alrededor d…
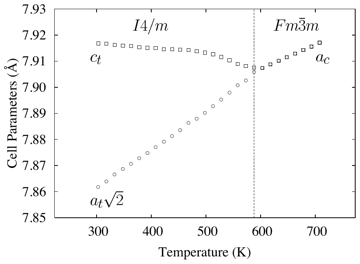 Figure 3.6 · cell-vs-t · Thesis 1 · Gateshki 2003Variación con la temperatura de los parámetros de la celda unidad de $\mathrm{Sr}_{2} \mathrm{NiWO}_{6}$. Existe una transición de fase alre…
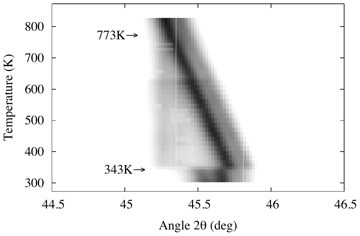 Figure 3.11 · cell-vs-t · Thesis 1 · Gateshki 2003Evolución con la temperatura de la reflexión cúbica (400) de $\mathrm{Sr}_{2} \mathrm{ZnWO}_{6}$. La transición de fase continua alrededor d…
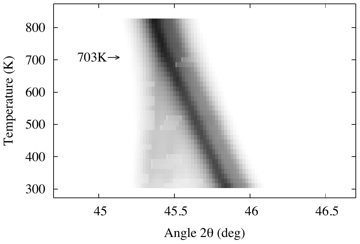 Figure 3.16 · cell-vs-t · Thesis 1 · Gateshki 2003Evolución con la temperatura de la reflexión cúbica (400) de $\mathrm{Sr}_{2} \mathrm{CoWO}_{6}$. Alrededor de 703 K aparece un desdoblamien…
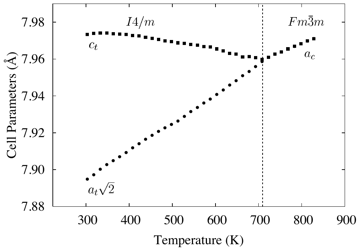 Figure 3.17 · cell-vs-t · Thesis 1 · Gateshki 2003Variación con la temperatura de los parámetros de la celda unidad de $\mathrm{Sr}_{2} \mathrm{CoWO}_{6}$. La estructura a altas temperaturas…
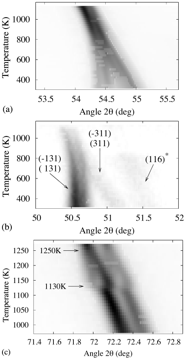 Figure 3.21 · cell-vs-t · Thesis 1 · Gateshki 2003Evolución con la temperatura de tres grupos de líneas de difracción de $\mathrm{Sr}_{2} \mathrm{CaWO}_{6}$. En (a) se puede observar un acer…
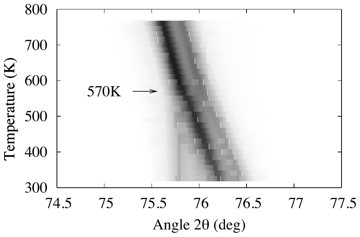 Figure 3.27 · cell-vs-t · Thesis 1 · Gateshki 2003Evolución con la temperatura de la reflexión cúbica (620) de $\mathrm{Sr}_{2} \mathrm{MgWO}_{6}$. La transición de fase continua de una fase…
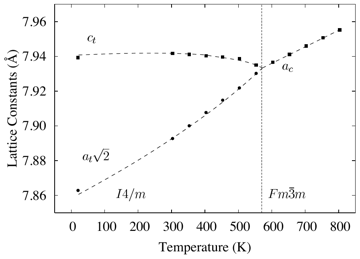 Figure 3.28 · cell-vs-t · Thesis 1 · Gateshki 2003Variación con la temperatura de los parámetros de celda de $\mathrm{Sr}_{2} \mathrm{MgWO}_{6}$.
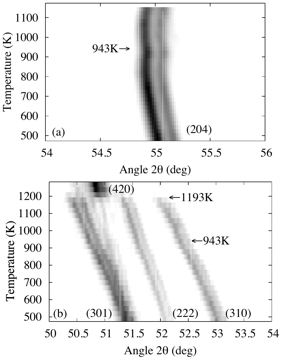 Figure 3.31 · cell-vs-t · Thesis 1 · Gateshki 2003Detalles de los perfiles de difracción de $\mathrm{Sr}_{2} \mathrm{CuWO}_{6}$, mostrando la evolución con la temperatura de algunos picos de…
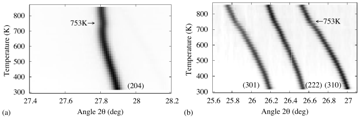 Figure 3.38 · cell-vs-t · Thesis 1 · Gateshki 2003Secciones de los perfiles de difracción de radiación sincrotrón de $\mathrm{Sr}_{2} \mathrm{CuWO}_{6}$: muestran la evolución con la tempera…
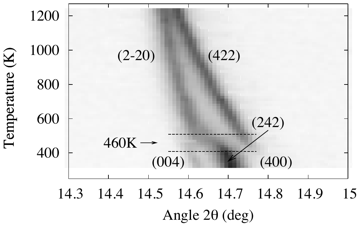 Figure 4.2 · cell-vs-t · Thesis 1 · Gateshki 2003Evolución con la temperatura del grupo de líneas de difracción con $2 \theta \approx 14.7^{\circ}$ obtenida para $\mathrm{SrLaMnRuO}_{6}$. L…
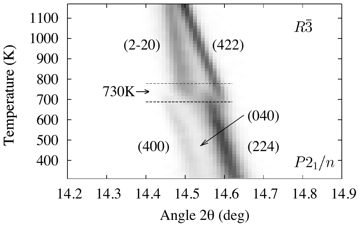 Figure 4.4 · cell-vs-t · Thesis 1 · Gateshki 2003Evolución con la temperatura del grupo de líneas de difracción en $2 \theta \approx 14.6$ obtenida para $\mathrm{SrLaCuRuO}_{6}$. La transic…
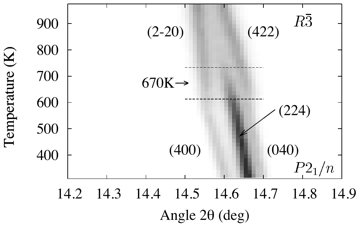 Figure 4.9 · cell-vs-t · Thesis 1 · Gateshki 2003Evolución con la temperatura del grupo de líneas de difracción con $2 \theta \approx 14.6^{\circ}$ de $\mathrm{SrLaNiRuO}_{6}$. La transició…
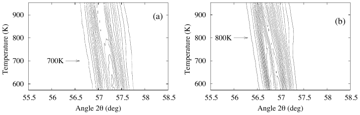 Figure 4.14 · cell-vs-t · Thesis 1 · Gateshki 2003Evolución con la temperatura de los grupos de picos de difracción de $\mathrm{SrLaFeRuO}_{6}$ (a) y $\mathrm{SrLaZnRuO}_{6}$ (b), que se enc…
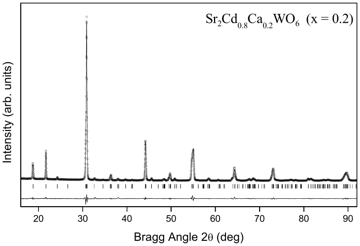 Figure 3 · cell-vs-t · Thesis 2 · Faik 2009shows the (a) $a, b$ and $c$ lattice parameters, (b) monoclinic angle ( $\beta$) and the (c) unit-cell volume of the synthesized materials.…
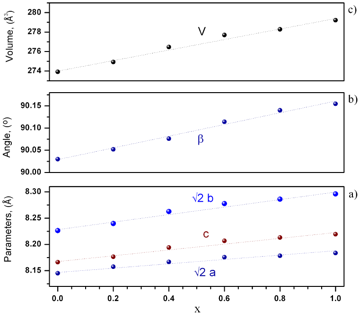 Figure 6.3 · cell-vs-t · Thesis 2 · Faik 2009Evolution, as a function of increasing calcium content, ( $x=0,0.2,0.4,0.6,0.8,1.0$), at room temperature, of the (a) unit-cell volume, (b)…
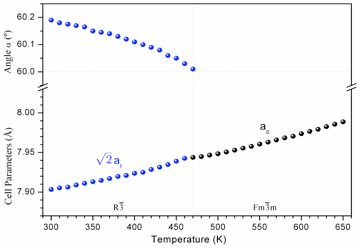 Figure 8 · cell-vs-t · Thesis 2 · Faik 2009shows the evolution with temperature of the lattice parameters of $\mathrm{Sr}_{2} \mathrm{CoSbO}_{6}$. In this figure we have represented t…
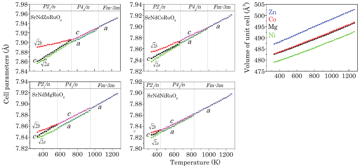 Figure 5.12 · cell-vs-t · Thesis 3 · Iturbe 2012Temperature evolution of the cell parameters and cell-volume of $\mathrm{SrNdMRuO}_{6} (M=\mathrm{Zn}, \mathrm{Co}, \mathrm{Mg}, \mathrm{Ni})$…
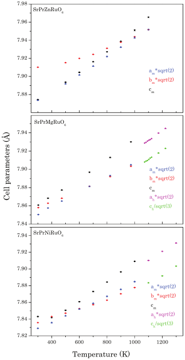 Figure 6.9 · cell-vs-t · Thesis 3 · Iturbe 2012Temperature evolution of the cell parameters of $\operatorname{SrPr} M \mathrm{MuO}_{6}(M=\mathrm{Zn}, \mathrm{Mg}, \mathrm{Ni})$ as obtaine…
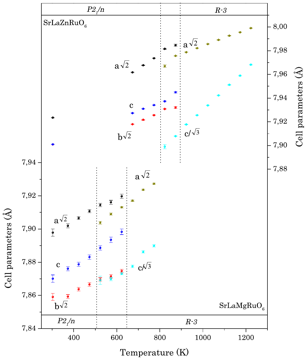 Figure 7.7 · cell-vs-t · Thesis 3 · Iturbe 2012Variation of the cell parameters for $\mathrm{SrLaZnRuO}_{6}$ and $\mathrm{SrLaMgRuO}_{6}$ with the temperature. Dashed lines indicate the c…
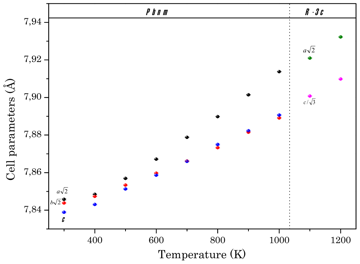 Figure 9.7 · cell-vs-t · Thesis 3 · Iturbe 2012Temperature evolution of the cell parameters of $\mathrm{SrPrFeRuO}_{6}$ as obtained from the NPD measurements: cell parameters of the ortho…
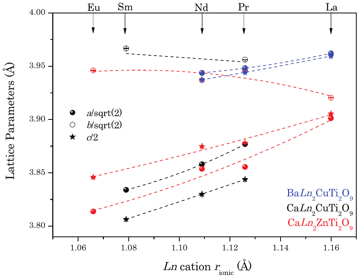 Figure 10.5 · cell-vs-t · Thesis 3 · Iturbe 2012Reduced cell parameters as a function of the lanthanide cation ionic radius for $\mathrm{CaLn}_{2} \mathrm{CuTi}_{2} \mathrm{O}_{9}(L n=\mathrm{Pr}, \mathrm{Nd}, \mathrm{Sm})($…
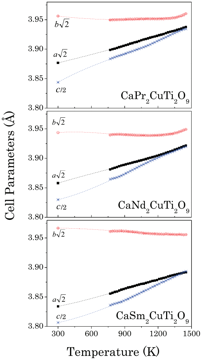 Figure 10.10 · cell-vs-t · Thesis 3 · Iturbe 2012Variation of the reduced cell parameters in the orthorhombic phase (space group Pbnm) with temperature for $\mathrm{CaLn}_{2} \mathrm{CuTi}_{2} \mathrm{O}_{9}(L n=\mathrm{Pr}, N d, S m)$…
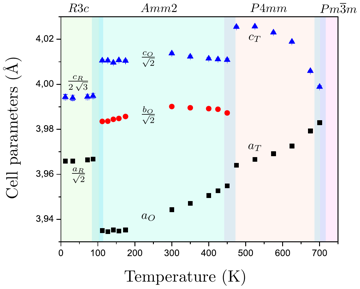 Figure 5.10 · cell-vs-t · Thesis 4 · Orayech 2015Thermal evolution of the lattice parameters of $\mathrm{Na}_{0.5} \mathrm{K}_{0.5} \mathrm{NbO}_{3}$, as obtained from XRPD and NPD measurem…
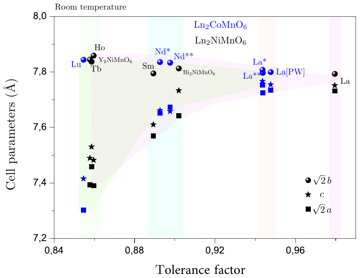 Figure 6.6 · cell-vs-t · Thesis 4 · Orayech 2015Evolution, at room temperature, of the cell parameters along the analyzed structures in the families: $\mathrm{Ln}_{2} \mathrm{CoMnO}_{6}$ (…
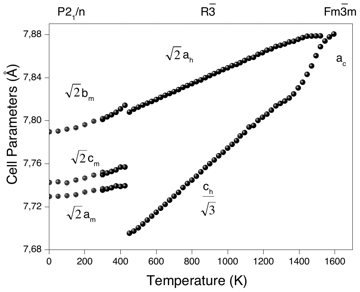 Figure 6.9 · cell-vs-t · Thesis 4 · Orayech 2015Variation with temperature of the lattice parameters for $\mathrm{La}_{2} \mathrm{CoMnO}_{6}$, as obtained from the NPD (2-300 K)(dimmed bla…
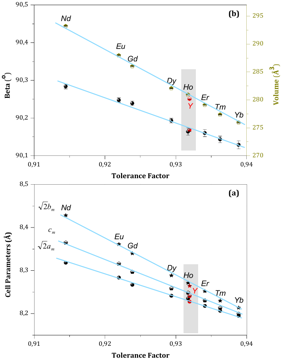 Figure 8.5 · cell-vs-t · Thesis 4 · Orayech 2015Evolution, as a function of the tolerance factor increasing of the unit-cell parameters (a), the unit-cell volume (b) and the monoclinic ang…
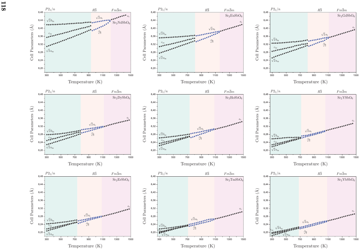 Figure 8.8 · cell-vs-t · Thesis 4 · Orayech 2015Temperature evolution of the lattice parameters of $\mathrm{Sr}_{2} \mathrm{MSbO}_{6}$. The cell parameters of the trigonal phase are shown…
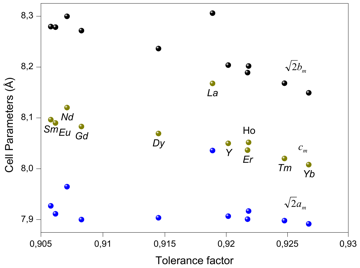 Figure 10.11 · cell-vs-t · Thesis 4 · Orayech 2015Evolution, as a function of the tolerance factor increasing of the unit-cell parameters (a), the unit-cell volume (b) and the monoclinic ang…