Plates · phase-diagram
Phase diagrams and transition maps. 4 plates.
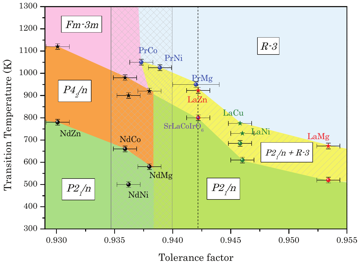 Figure 7.10 · phase-diagram · Thesis 3 · Iturbe 2012Experimentally calculated tolerance factor and temperature dependence phase diagram of $\mathrm{SrLaMRuO}_{6}(\mathrm{M}=\mathrm{Zn}[\mathrm{PW}], \mathrm{Cu}[116], \mathrm{Mg}[\mathrm{PW}], \mathrm{Ni}[116]), \mathrm{SrNdMRuO}_{6}(\mathrm{M}=\mathrm{Zn}, \mathrm{Co}, \mathrm{Mg}, \mathrm{Ni})[120]$…
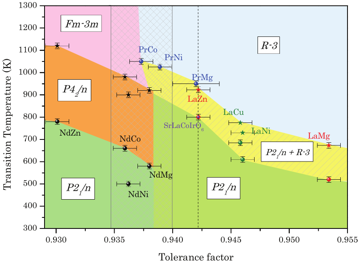 Figure 10.13 · phase-diagram · Thesis 3 · Iturbe 2012Tolerance factor and temperature dependence phase diagram of $\mathrm{SrLaMRuO}_{6} (\mathrm{M}=\mathrm{Zn}(\mathrm{PW}), \mathrm{Cu}[116], \mathrm{Mg}(\mathrm{PW}), \mathrm{Ni}[116]), \quad \mathrm{SrNdMRuO}_{6} \quad(\mathrm{M}=\mathrm{Zn}, \mathrm{Co}, \mathrm{Mg}, \mathrm{Ni}) \quad[120] \quad$…
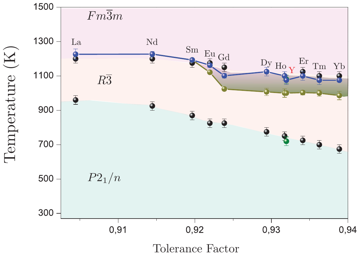 Figure 8.9 · phase-diagram · Thesis 4 · Orayech 2015Phase diagram (phase transition temperatures versus tolerance factors) for the $\mathrm{Sr}_{2} \mathrm{MSbO}_{6}$ ( $\mathrm{M}=\mathrm{Ln}, \mathrm{Y}$…
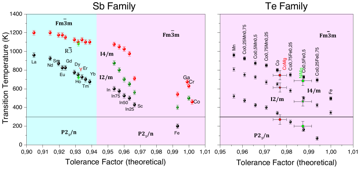 Figure 10.6 · phase-diagram · Thesis 4 · Orayech 2015Tolerance factor and temperature dependence phase diagram of $\mathrm{Sr}_{2} \mathrm{MSbO}_{6}$ and $\mathrm{Sr}_{2} \mathrm{MTeO}_{6}$. Th…